
MATLAB: An Introduction with Applications
6th Edition
ISBN: 9781119256830
Author: Amos Gilat
Publisher: John Wiley & Sons Inc
expand_more
expand_more
format_list_bulleted
Related questions
Question
thumb_up100%
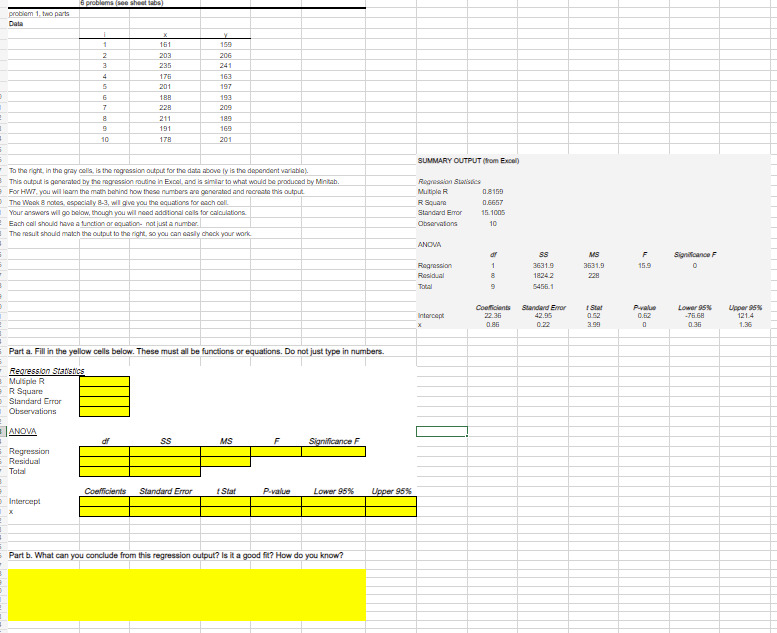

Transcribed Image Text:problem 1, two parts
Data
6 problems (see sheet tabs)
ANOVA
i
1
2
3
4
Regression
Residual
Tatal
5
6
7
8
Intercept
10
X
X
161
203
235
176
201
188
228
To the right, in the gray cells, is the regression output for the data above (y is the dependent variable).
This output is generated by the regression routine in Excel, and is similar to what would be produced by Minitab.
For HWT, you will learn the math behind how these numbers are generated and recreate this output
211
191
178
The Week 8 notes, especially 8-3, will give you the equations for each call
Your answers will go below, though you will need additional calls for calculations.
df
Each call should have a function or equation not just a number.
The result should match the output to the right, so you can easily check your work
Part a. Fill in the yellow cells below. These must all be functions or equations. Do not just type in numbers.
Regression Statistics
Multiple R
R Square
Standard Error
Observations
Y
159
206
241
163
197
193
209
189
169
201
SS
Coefficients Standard Error
MS
t Stat
F
P-value
Significance F
Lower 95%
Part b. What can you conclude from this regression output? Is it a good fit? How do you know?
Upper 95%
SUMMARY OUTPUT (from Excel)
Regression Statistics
Multiple R
R Square
Standard Error
Observations
ANOVA
Regression
Residual
Total
Intercept
X
0.8159
0.6657
15.1005
10
dr
1
8
9
Coefficients
22.36
0.86
SS
3631.9
1824.2
5456.1
Standard Error
42.95
0.22
MS
3631.9
228
1 Stat
0.52
3.99
F
15.9
P-value
0.62
0
Significance F
0
Lower 95%
-76.68
0.36
Upper 95%
121.4
1.36
Expert Solution
This question has been solved!
Explore an expertly crafted, step-by-step solution for a thorough understanding of key concepts.

This is a popular solution

Trending nowThis is a popular solution!

Step by stepSolved in 7 steps with 34 images

Knowledge Booster

Similar questions
- The following table shows the reported net sales by Nokia in 2008, 2009, and 2010. Year 2008 2009 2010x 0 1 2Sales ($ millions) 20 50 60 Find the Equation of the Linear Regression Line. Rounds decimal values to the nearest tenths.arrow_forwardComplete parts (a) through (c) using the following data. Row 1 1 Row 2 94 1 82 2 82 2 70 C 5 91 5 72 6 75 Input the values of the slope and intercept for the regression line when Row 1 represents the x-values. ŷ=x+ (Round to three decimal places as needed.) 6 81 6 65 8 69 2 (a) Find the equation of the regression line for the given data, letting Row 1 represent the x-values and Row 2 the y-values. Sketch a scatter plot of the data and draw the regression line.arrow_forwardA corporation has asked you to prepare some multiple regression equations to estimate the effect of variables on fuel economy. The data for this study are shown below, and the dependent variable is miles per gallon. Complete parts a and b. Miles 43.3 Horsepower 50 Weight 1985 36.3 67 1885 32.7 51 1990 + ŷ =) ()×₁ + ( )×₂ (Round to four decimal places as needed.) 39.5 72 2090 36 62 1880 19.2 110 3370 19.1 142 3775 20.9 136 3560 19.9 101 3165 a. Prepare a regression equation that uses vehicle horsepower and vehicle weight as independent variables. Let x₁ be defined as horsepower and x₂ be defined as weight. 20.8 94 2720arrow_forward
- In R there is a dataset called diamonds that contains measurements of about 500 diamonds sold in the US. There are three variables present: price (price in US dollar), carat (weight of the diamond), and table (width of top of diamond relative to the widest point). The attached image is a screenshot of the R dataset with the regression table and all that. ANSWER THIS QUESTION IN WORDS: Discuss the regression between the variables table and price. You should address the explanatory variable, response variable, correlation, and sign. You should interpret the slope, the t and p-value, and how much is explained by the response.arrow_forwardPLEASE ANSWER 4,5 AND 6arrow_forwardWhat is the explanatory variable, what is the response variable. What is the regression equation for this data. Plot the regression line in your calculator and draw it on your graph. Interpret in context the slope. Interpret in context the y-intercept. What is the residual at 45 years of age. Plot the residual plot on the axis to the rightarrow_forward
arrow_back_ios
arrow_forward_ios
Recommended textbooks for you
- MATLAB: An Introduction with ApplicationsStatisticsISBN:9781119256830Author:Amos GilatPublisher:John Wiley & Sons Inc
 Probability and Statistics for Engineering and th...StatisticsISBN:9781305251809Author:Jay L. DevorePublisher:Cengage Learning
 Statistics for The Behavioral Sciences (MindTap C...StatisticsISBN:9781305504912Author:Frederick J Gravetter, Larry B. WallnauPublisher:Cengage Learning
  Elementary Statistics: Picturing the World (7th E...StatisticsISBN:9780134683416Author:Ron Larson, Betsy FarberPublisher:PEARSON
 The Basic Practice of StatisticsStatisticsISBN:9781319042578Author:David S. Moore, William I. Notz, Michael A. FlignerPublisher:W. H. Freeman
 Introduction to the Practice of StatisticsStatisticsISBN:9781319013387Author:David S. Moore, George P. McCabe, Bruce A. CraigPublisher:W. H. Freeman
MATLAB: An Introduction with Applications
Statistics
ISBN:9781119256830
Author:Amos Gilat
Publisher:John Wiley & Sons Inc
Probability and Statistics for Engineering and th...
Statistics
ISBN:9781305251809
Author:Jay L. Devore
Publisher:Cengage Learning
Statistics for The Behavioral Sciences (MindTap C...
Statistics
ISBN:9781305504912
Author:Frederick J Gravetter, Larry B. Wallnau
Publisher:Cengage Learning
Elementary Statistics: Picturing the World (7th E...
Statistics
ISBN:9780134683416
Author:Ron Larson, Betsy Farber
Publisher:PEARSON
The Basic Practice of Statistics
Statistics
ISBN:9781319042578
Author:David S. Moore, William I. Notz, Michael A. Fligner
Publisher:W. H. Freeman
Introduction to the Practice of Statistics
Statistics
ISBN:9781319013387
Author:David S. Moore, George P. McCabe, Bruce A. Craig
Publisher:W. H. Freeman