
Database System Concepts
7th Edition
ISBN: 9780078022159
Author: Abraham Silberschatz Professor, Henry F. Korth, S. Sudarshan
Publisher: McGraw-Hill Education
expand_more
expand_more
format_list_bulleted
Related questions
Question
Please provide the hypothetical code to this. I am not able to provide that excel data since it's already imbedded. Please dont forget to convert the Count variable data into a numerical array called count.
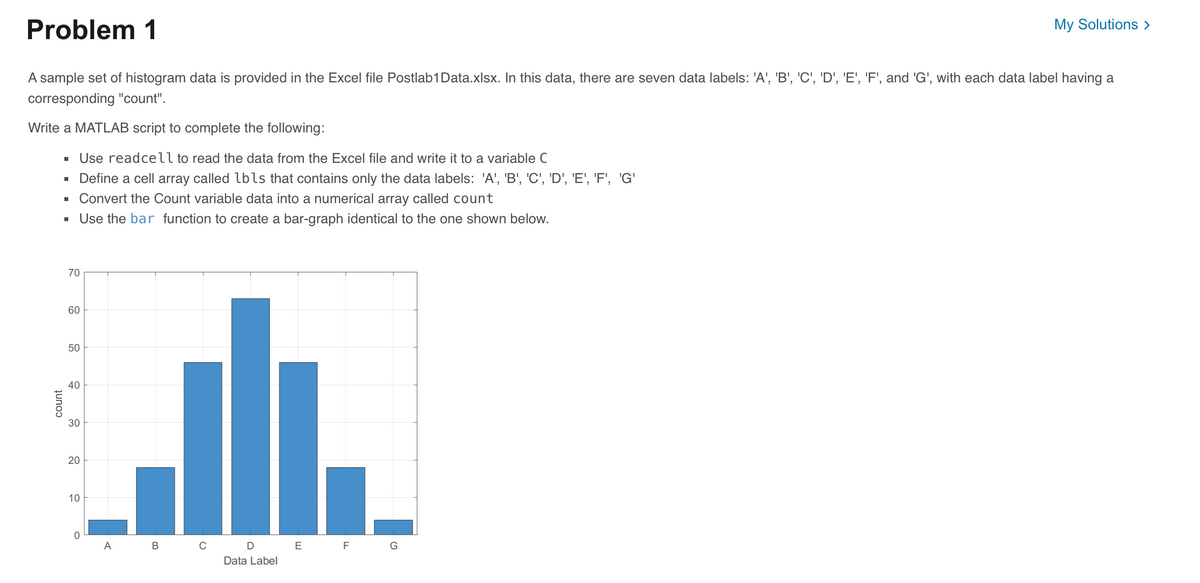

Transcribed Image Text:Problem 1
My Solutions >
A sample set of histogram data is provided in the Excel file Postlab1Data.xlsx. In this data, there are seven data labels: 'A', 'B', 'C', 'D', 'E', 'F', and 'G', with each data label having a
corresponding "count".
Write a MATLAB script to complete the following:
■
Use readcell to read the data from the Excel file and write it to a variable C
■
Define a cell array called lbls that contains only the data labels: 'A', 'B', 'C', 'D', 'E', 'F', 'G'
◉
Convert the Count variable data into a numerical array called count
Use the bar function to create a bar-graph identical to the one shown below.
70
count
60
50
40
40
30
20
10
0
A
B
0
D
E F
G
Data Label
Expert Solution
This question has been solved!
Explore an expertly crafted, step-by-step solution for a thorough understanding of key concepts.

Step by stepSolved in 2 steps

Knowledge Booster

Similar questions
- Please write your own original code. Objective Create a program that initializes and works with string variables. Create a program named LastnameFirstname15.c, that does the following: Note: There is no user input for this program. Declare and initialize a char array that stores your first name in title case. Title case means the first letter is uppercase and the rest is lowercase. Ensure the size/length of the array is equal to the length of your name plus the null character.As an example, my first name is Edward, therefore the size of the array will be 7.char firstname[7] = "Edward"; Declare and initialize another char array that stores your last name in title case. Ensure the size/length of the array is equal to the length of your name plus the null character. Use the strlen function to get the lengths of each name and store them in separate variables. Calculate the total length of your name by adding the lengths of the first name and last name and store it in another…arrow_forwardCode the 100 locker problem. Requirements 1. Only use printf statements in code 2. Must print out the final state of the array as a 10x10 array with clean formattingarrow_forwardAdd a prompt to ask the user to input their last name (no spaces ; please use underscores if needed), age and a balance of their choice. Create a new entry in the patient_list array with this information [Important note: you can statically modify the code to have the patient_list array hold an extra entry ; no need to do any dynamic memory allocation to accommodate the new entry]. #include <iostream> #include <cstdlib> #include <cstring> using namespace std; // Declaring a new struct to store patient data struct patient { int age; char name[20]; float balance; }; // TODO: // IMPLEMENT A FUNCTION THAT COMPARES TWO PATIENTS BY AGE // THE FUNCTION RETURNS AN INTEGER AS FOLLOWS: // -1 IF THE AGE OF THE FIRST PATIENT IS LESS // THAN THE SECOND PATIENT'S AGE // 0 IF THE AGES ARE EQUAL // 1 OTHERWISE // TODO: // IMPLEMENT A FUNCTION THAT COMPARES TWO PATIENTS BY BALANCE DUE // THE FUNCTION RETURNS AN INTEGER AS…arrow_forward
- Define the array printed below using the np.array() function, and assign it to the variable 'my_array' (only one line of code needed). [[0, 2, 4],[9, -6, 5],[0, 0, -10]]arrow_forwardCode two functions to fill an array with the names of every World Series winning team from 1903 to 2020, then output each World Series winner and the number of times the team won the championship. The input file is attached, along with a main function and screen print. Please note team names that include two words, such as Red Sox, have an underscore in place of the space. This enables you to use the extraction operator with a single string variable. My program is not working can you help me figure out who to make it run? It needs to contain these specific things Code a function to fill an empty array Fill an array from an input file Search the array for specific elements Output specific array elements as part of a string Use a for loop to step through an array Use a for loop to count occurrences in an array Use a conditional statement within a for loop used to process an array Use input stream objects Use string objects I attached the world series winners list and a preview of…arrow_forwardI have an error inside my simple javascript code, I want you to fix it. The code is simple. The code is supposed to print an array with 10 elements, but when it comes to one element inside the array, it is supposed to concatenate a string value The problem with my code is it is printing all elements of the array, but it is not concatenating a string to one element. The problem is inside my print_array_changed function Generally, the code is required to print all elements with one element having a concatenated string. Look inside the print_array_changed function and fix it to attain the desired goal Code // create an array and assign values inside it const Employees = [ "JACK", "JILL", "Homer", "Lisa", "Bart", "Marge", "Burns", "Maggie" , "Amy", "Bill", ] // This function prints all elements…arrow_forward
arrow_back_ios
arrow_forward_ios
Recommended textbooks for you
- Database System ConceptsComputer ScienceISBN:9780078022159Author:Abraham Silberschatz Professor, Henry F. Korth, S. SudarshanPublisher:McGraw-Hill Education
 Starting Out with Python (4th Edition)Computer ScienceISBN:9780134444321Author:Tony GaddisPublisher:PEARSON
 Digital Fundamentals (11th Edition)Computer ScienceISBN:9780132737968Author:Thomas L. FloydPublisher:PEARSON
  C How to Program (8th Edition)Computer ScienceISBN:9780133976892Author:Paul J. Deitel, Harvey DeitelPublisher:PEARSON
 Database Systems: Design, Implementation, & Manag...Computer ScienceISBN:9781337627900Author:Carlos Coronel, Steven MorrisPublisher:Cengage Learning
 Programmable Logic ControllersComputer ScienceISBN:9780073373843Author:Frank D. PetruzellaPublisher:McGraw-Hill Education
Database System Concepts
Computer Science
ISBN:9780078022159
Author:Abraham Silberschatz Professor, Henry F. Korth, S. Sudarshan
Publisher:McGraw-Hill Education
Starting Out with Python (4th Edition)
Computer Science
ISBN:9780134444321
Author:Tony Gaddis
Publisher:PEARSON
Digital Fundamentals (11th Edition)
Computer Science
ISBN:9780132737968
Author:Thomas L. Floyd
Publisher:PEARSON
C How to Program (8th Edition)
Computer Science
ISBN:9780133976892
Author:Paul J. Deitel, Harvey Deitel
Publisher:PEARSON
Database Systems: Design, Implementation, & Manag...
Computer Science
ISBN:9781337627900
Author:Carlos Coronel, Steven Morris
Publisher:Cengage Learning
Programmable Logic Controllers
Computer Science
ISBN:9780073373843
Author:Frank D. Petruzella
Publisher:McGraw-Hill Education