MATLAB: An Introduction with Applications
6th Edition
ISBN: 9781119256830
Author: Amos Gilat
Publisher: John Wiley & Sons Inc
expand_more
expand_more
format_list_bulleted
Question

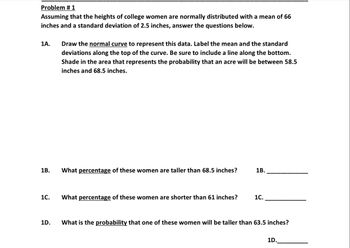
Transcribed Image Text:**Problem # 1**
Assuming that the heights of college women are normally distributed with a mean of 66 inches and a standard deviation of 2.5 inches, answer the questions below.
**1A.** Draw the **normal curve** to represent this data. Label the mean and the standard deviations along the top of the curve. Be sure to include a line along the bottom. Shade in the area that represents the probability that a college woman’s height will be between 58.5 inches and 68.5 inches.
**1B.** What *percentage* of these women are taller than 68.5 inches? 1B. ___________
**1C.** What *percentage* of these women are shorter than 61 inches? 1C. ___________
**1D.** What is the *probability* that one of these women will be taller than 63.5 inches? 1D. ___________
Expert Solution
arrow_forward
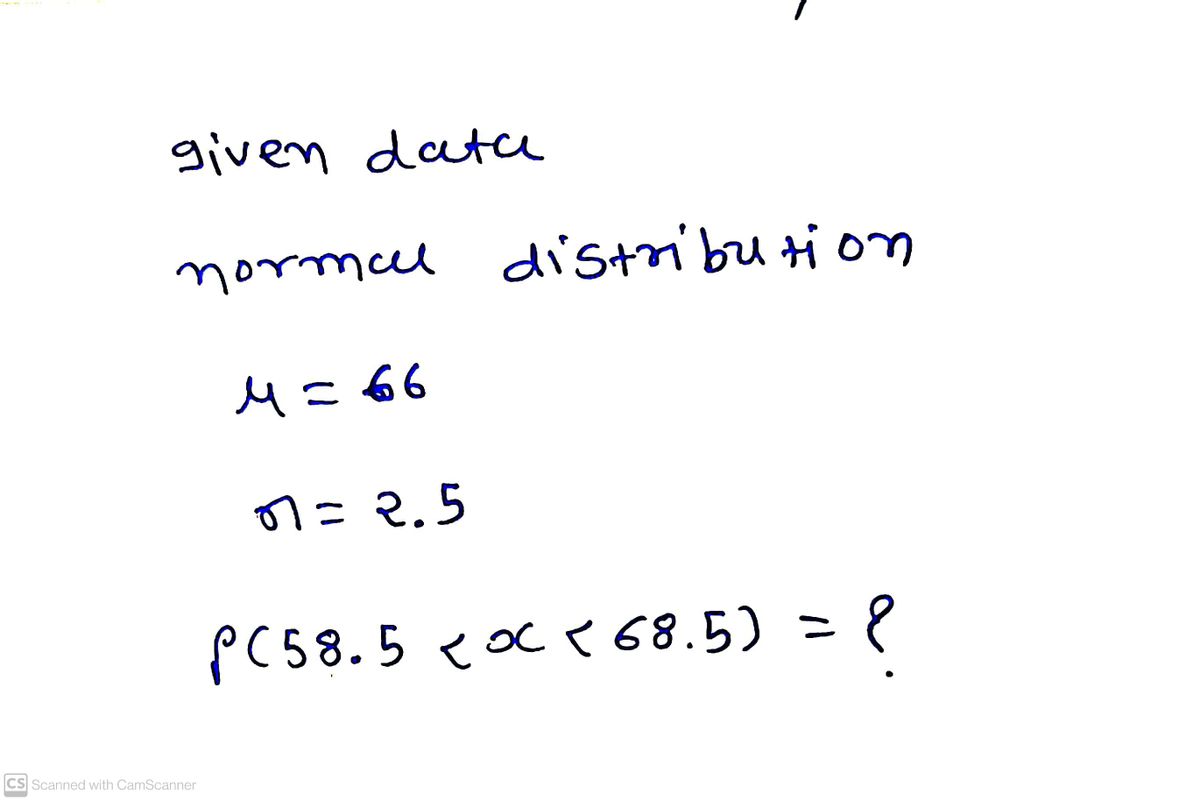
Step 1

Step by stepSolved in 3 steps with 3 images

Knowledge Booster
Similar questions
- please explain how to find proportions and how I know which side the tail lands on.arrow_forwardOne graph in the figure represents a normal distribution with mean u= 15 and standard deviation o = 2. The other graph represents a normal distribution with mean u=11 and standard deviation o = 2. Determine which graph is which and explain how you know. A B 11 15 ... Choose the correct answer below. O A. Graph A has a mean of u = 15 and graph B has a mean of u = 11 because a larger mean shifts the graph to the right. O B. Graph A has a mean of u = 11 and graph B has a mean of u= 15 because a larger mean shifts the graph to the left. O C. Graph A has a mean of u = 11 and graph B has a mean of u = 15 because a larger mean shifts the graph to the right. O D. Graph A has a mean of u = 15 and graph B has a mean of u = 11 because a larger mean shifts the graph to the left.arrow_forwardOne graph in the figure represents a normal distribution with mean = 15 and standard deviation o = 2. The other graph represents a normal distribution with mean u = 7 and standard deviation o = 2. Determine which graph is which and explain how you know .. Choose the correct answer below. OA. Graph A has a mean of μ = 15 and graph B has a mean of µ = 7 because a larger mean shifts the graph to the left. OB. Graph A has a mean of µ = 15 and graph B has a mean of μ = 7 because a larger mean shifts the graph to the right. OC. Graph A has a mean of u = 7 and graph B has a mean of μ = 15 because a larger mean shifts the graph to the right. G D. Graph A has a mean of μ = 7 and graph B has a mean of µ = 15 because a larger mean shifts the graph to the left. 7 15 B Marrow_forward
- The scores and their percent of the final grade for a statistics student are given. What is the student's weighted mean score? The student's weighted mean score is. (Simplify your answer. Round to two decimal places as needed.) Homework Quiz Quiz Project Final Exam Score Percent of final grade 85 90 90 98 89 15 10 10 35 30arrow_forwardThink of your own example of a data set that would follow a normal distribution and explain why.arrow_forwardPsychology students at a university completed the Dental Anxiety Scale questionnaire. Scores on the scale range from 0 (no anxiety) to 20 (extreme anxiety). The mean score was 11 and the standard deviation was 3.5. Assume that the distribution of all scores on the Dental Anxiety Scale is normal with u = 11 and o = 3.5. Complete parts a through c. Click here to view a table of areas under the standardized normal curve. a. Suppose you score a 18 on the Dental Anxiety Scale. Find the z-value for this score. z= 2 (Round to the nearest hundredth as needed.) b. Find the probability that someone scores between 10 and 15 on the Dental Anxiety Scale. P(10sxs 15) = (Round to four decimal places as needed.) c. Find the probability that someone scores above 17 on the Dental Anxiety Scale. P(x> 17) =| (Round to four decimal places as needed.)arrow_forward
- Would enjoy the help. 4arrow_forwardAssume the birth weights at a local hospital have a normal distribution with a mean of 110 oz and a standard deviation of 15 oz. Draw a normal curve and label the mean and each value which is one, two, or three standard deviations above the mean. Then label each value which is one, two, or three standard deviations below the mean.arrow_forwardSketch a standard normal curve and shade the area that lies to the left of a. 2.15, b. - 1.61, c. 0, and d. - 7. Then determine the area under the standard normal curve that lies in the area of interest for each part. Click here to view page 1 of the normal distribution table. Click here to view page 2 of the normal distribution table. c. Sketch a standard normal curve and shade the area under the curve that lies to the left of 0. Choose the correct graph below. A. 0 Z G OB. 0 The area to the left of 0 is (Round to four decimal places as needed.) O C. -1 0 O D. -1 0 Time Remaining: 01:09:16 Nextarrow_forward
arrow_back_ios
SEE MORE QUESTIONS
arrow_forward_ios
Recommended textbooks for you
 MATLAB: An Introduction with ApplicationsStatisticsISBN:9781119256830Author:Amos GilatPublisher:John Wiley & Sons Inc
 Probability and Statistics for Engineering and th...StatisticsISBN:9781305251809Author:Jay L. DevorePublisher:Cengage Learning
 Statistics for The Behavioral Sciences (MindTap C...StatisticsISBN:9781305504912Author:Frederick J Gravetter, Larry B. WallnauPublisher:Cengage Learning
 Elementary Statistics: Picturing the World (7th E...StatisticsISBN:9780134683416Author:Ron Larson, Betsy FarberPublisher:PEARSON
 The Basic Practice of StatisticsStatisticsISBN:9781319042578Author:David S. Moore, William I. Notz, Michael A. FlignerPublisher:W. H. Freeman
 Introduction to the Practice of StatisticsStatisticsISBN:9781319013387Author:David S. Moore, George P. McCabe, Bruce A. CraigPublisher:W. H. Freeman

MATLAB: An Introduction with Applications
Statistics
ISBN:9781119256830
Author:Amos Gilat
Publisher:John Wiley & Sons Inc

Probability and Statistics for Engineering and th...
Statistics
ISBN:9781305251809
Author:Jay L. Devore
Publisher:Cengage Learning

Statistics for The Behavioral Sciences (MindTap C...
Statistics
ISBN:9781305504912
Author:Frederick J Gravetter, Larry B. Wallnau
Publisher:Cengage Learning

Elementary Statistics: Picturing the World (7th E...
Statistics
ISBN:9780134683416
Author:Ron Larson, Betsy Farber
Publisher:PEARSON

The Basic Practice of Statistics
Statistics
ISBN:9781319042578
Author:David S. Moore, William I. Notz, Michael A. Fligner
Publisher:W. H. Freeman

Introduction to the Practice of Statistics
Statistics
ISBN:9781319013387
Author:David S. Moore, George P. McCabe, Bruce A. Craig
Publisher:W. H. Freeman