
A First Course in Probability (10th Edition)
10th Edition
ISBN: 9780134753119
Author: Sheldon Ross
Publisher: PEARSON
expand_more
expand_more
format_list_bulleted
Related questions
Question
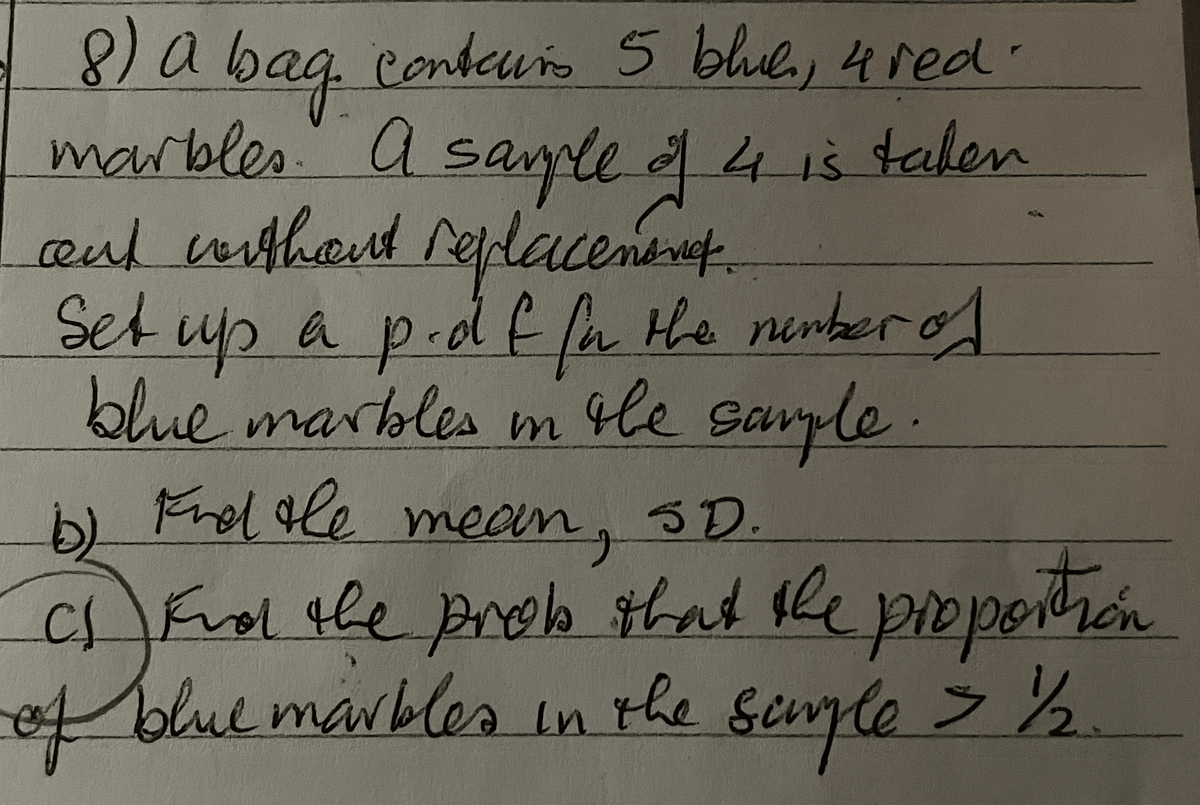

Transcribed Image Text:8) a bag contours 5 blue, 4 red.
marbles. A sample of 4 is taken
and without replacement.
Set up a p-df. for the number of
blue marbles in the sample.
b) Find the mean, SD.
C
cf Find the prob that the proportion
of blue marbles in the sample > 1½/2
Expert Solution
This question has been solved!
Explore an expertly crafted, step-by-step solution for a thorough understanding of key concepts.

Step by stepSolved in 4 steps with 5 images

Knowledge Booster

Similar questions
- Six damaged cars are selected and taken to bothgarages A and B for estimates. Find the 95% CI forthe difference between the population meanestimates for each garage. 1 2 3 4 5 6 A 890 900 910 710 990 650 B 880 1010 980 790 1042 600arrow_forwardThe data table shows the ages in years of 10 men with systolic blood pressure. The Age,x: 18, 24, 39, 45, 49, 63, 71, 29, 57, 22 and systolic blood pressure, y: 109, 121, 142, 133, 199, 186, 199, 132, 177, 117. The sample correlation coefficient r is 0.913. Remove the data entry for the man who is 49 years old and has a systolic blood pressure of 199 millimeters of mercury from the data set and find the new correlation coefficient.arrow_forwardEach of the 5 cats in a pet store was weighed. Here are their weights (in pounds). 13, 12, 5, 12, 9 Find the median and mean weights of these cats. If necessary, round your answers to the nearest tenth. (a) Median: pounds X Ś ? (b) Mean: poundsarrow_forward
- Thanks. Why is Kathy's score considered better-is it because it is a posituve score? What does the Z score represent in this case?arrow_forwardA veterinarian recorded how many kittens were born in each litter. This data is summarized in the histogram below. (Note: The last class actually represents "7 or more kittens," not just 7 kittens.) QUESTIONL: What is the frequency of the litter having at most 2 kittens? (PHOTO ATTACHED)arrow_forwardHere are the fuel efficiencies (in mpg) of 15 new cars. 49, 35, 17, 21, 27, 23, 45, 50, 39, 51, 41, 47, 25, 14, 29 What is the percentage of these cars with a fuel efficiency less than 40 mpg?arrow_forward
- A researcher wants to determine the mean level of mercury found in 3 species of salt water shellfish: clam, oyster and crab. She randomly samples 100 shellfish of each species. She measures the amount of mercury in each specimen. 1. What is the experimental unit? [Select] 2. What is the response variable? [Select] 3. What is the factor? [Select] 4. What are the factor levels? [Select] > > > >arrow_forwardFind the median and lower quartile of the number of wins of the Mariners for 6 years. Years and wins below: 2010/2011/2012/2013/2014/2015 71 61 72 86 89 95 A) Find the median. Show work. B) Find the lower quartile. Show work.arrow_forwardI need help with 5 a,b,carrow_forward
- A sales manager recorded the number of sales made by each of the 300 salespeople working athis chain of furniture outlet stores on a Saturday and created the following table.# Sales (bins) Proportion of salespeople in this bin0 – 3 0.053 – 6 0.156 – 9 0.30 9 – 12 0.3512 -15 0.15a. What is the unit of observation in this sample?b. What is the variable collected?c. Draw and label the histogram for this dataset.d. Which is the modal category?e. Calculate the proportion of the salespeople made 9 or more sales.f. Calculate the number of salespeople who made between 0 and 9 sales.arrow_forward7. Find the z-score that cuts off a left tail whose area is 2.5%. 8. Find the z-score that cuts off a right tail whose area is 10.75%.arrow_forwardGiven the 1st and 3rd quartiles of a data are 24 and 48, respectively, what value would be considered an outlier? A 83 B D 88 72 Can't tell.arrow_forward
arrow_back_ios
SEE MORE QUESTIONS
arrow_forward_ios
Recommended textbooks for you
- A First Course in Probability (10th Edition)ProbabilityISBN:9780134753119Author:Sheldon RossPublisher:PEARSON

A First Course in Probability (10th Edition)
Probability
ISBN:9780134753119
Author:Sheldon Ross
Publisher:PEARSON