
ENGR.ECONOMIC ANALYSIS
14th Edition
ISBN: 9780190931919
Author: NEWNAN
Publisher: Oxford University Press
expand_more
expand_more
format_list_bulleted
Related questions
Question

Transcribed Image Text:P₁
4
91
7
8
9
O A. areas 1, 2, 5 and 6
OB. areas 1 and 2
OC. area 2
OD. area 3
O E. areas 5 and 6
Qo
Quantity
Supply
Demand
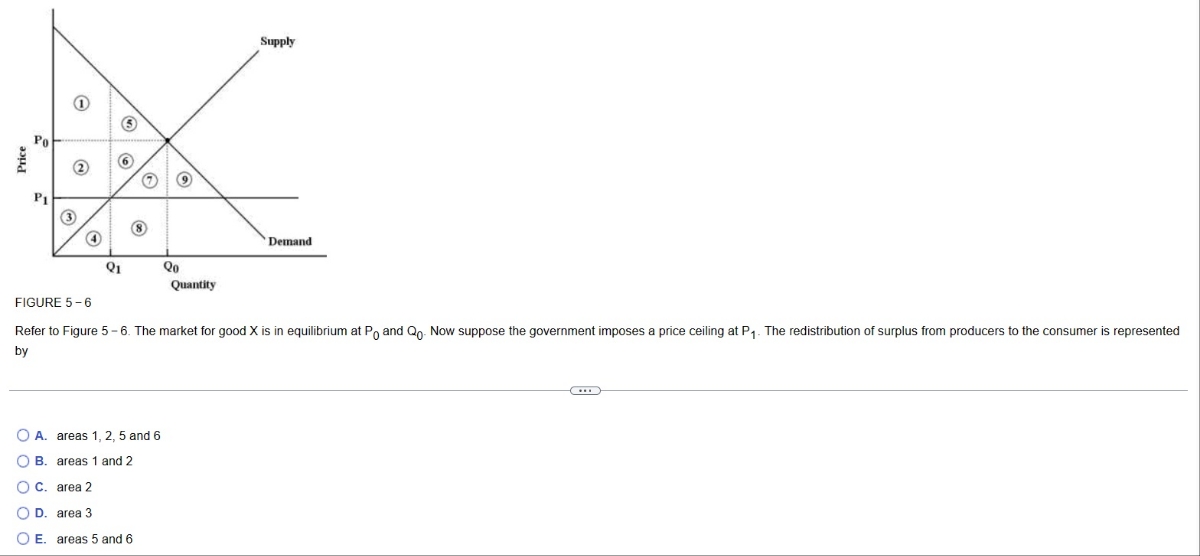
FIGURE 5-6
Refer to Figure 5-6. The market for good X is in equilibrium at Po and Qo. Now suppose the government imposes a price ceiling at P₁. The redistribution of surplus from producers to the consumer is represented
by
...
Expert Solution
This question has been solved!
Explore an expertly crafted, step-by-step solution for a thorough understanding of key concepts.

Step by stepSolved in 3 steps

Knowledge Booster


Learn more about
Need a deep-dive on the concept behind this application? Look no further. Learn more about this topic, economics and related others by exploring similar questions and additional content below.Similar questions
- Don't use chatgpt and make sure you include the graphs needed (a) Suppose in a competitive market, the market demand curve for salt is infinitelyinelastic. What is the impact of a per-unit tax (i.e. a specific tax) on the priceof salt that consumers pay?(b) Suppose the demand curve for butter is Q = 50 − 3P and the supply curve isQ = 2P. Suppose the government announces a per-unit tax of 1 on the priceof butter. Tax on butter can be seen as a ’fat tax’. What is the overall effectof a fat tax on the consumers? (c) If you were a policymaker and wanted to promote a fat tax in the UK, whatwould you cover in your policy campaign?arrow_forwardFigure 7-4 Price P₂ P₁ o с D 9₂ B E 82 Quantity Refer to Figure 7-4. What will NOT occur when the price falls from P2 to P1? a. The total quantity sold in the market increases. b. The sellers who still sell the good are worse off because they now receive less. OC. The total cost of what is now sold by sellers is actually higher. X d. Producer surplus would fall by area A + B.arrow_forwardRefer to the graph shown. With an effective price ceiling at $3, total surplus is reduced by: Please see attached image.arrow_forward
- Price of X P1 P2 P3 1 A. 0. B. Q3 Q5. O C. Q2Q4. O D. Q1Q3. O E. Q1Q5. T Q1 Q2 Q3 Q4 Q5 Quantity of X Supply Demand FIGURE 3-3 Refer to Figure 3-3. At a price of P2 there would be excess demand equal toarrow_forwardFigure 3-15 Price P2 в P1 Q1 Q2 Quantity Refer to Figure 3-15. Which area represents producer surplus when the price is P1? BCE ACF ABED DEFarrow_forwardDefine consumer and producer surplus and give a geometric interpretation of each.arrow_forward
- Comsumer Surplus Study The goal of this assignment is to apply Calculus to analyze consumer and producer surplus. This activity is based off the economical principles discussed in Section 3.1 of "Principle of Economics" and Section 7 of Chapter 3 in the Business Calculus book. The table below shows how supply and demand of gasoliine vary depending on the price: Price ($/gal) Demand (million of gal.) Supply (million of gal.) 753 513 550 1.2 700 1.4 640 600 1.6 580 639 1.8 543 660 2.2 450 680 2.4 430 700 2.6 420 720 2.8 390 735 3. 367 763 Note: there is some randomization in the above data to account for price fluctuations. Make sure to check that you input the correct data in your device. Perform the following work • Assume that Supply has a quadratic relationship with the price. Find this relationship (the help buttons contain an article to compute trend-lines in Excel): S(p) = Round your answer to 3 decimal places %3D • Assume that the Demand has a quadratic relationship with the…arrow_forwardFigure 6-12 [price of gasoline P3 2 PI Q3 less than Q 01 Refer to Figure 6-12. When the price ceiling applies in this market, and the supply curve for gasoline shifts from S₁ to S₂, the resulting quantity of gasoline that is bought and sold is O Q₁. O between Q₁ and Q₁ O at least Q₁- price ceiling D iyofanarrow_forwardPlease send me answer within 10 min!! Provide explanation!! I will rate you good for sure!!arrow_forward
arrow_back_ios
arrow_forward_ios
Recommended textbooks for you
 Principles of Economics (12th Edition)EconomicsISBN:9780134078779Author:Karl E. Case, Ray C. Fair, Sharon E. OsterPublisher:PEARSON
 Engineering Economy (17th Edition)EconomicsISBN:9780134870069Author:William G. Sullivan, Elin M. Wicks, C. Patrick KoellingPublisher:PEARSON
 Principles of Economics (MindTap Course List)EconomicsISBN:9781305585126Author:N. Gregory MankiwPublisher:Cengage Learning
 Managerial Economics: A Problem Solving ApproachEconomicsISBN:9781337106665Author:Luke M. Froeb, Brian T. McCann, Michael R. Ward, Mike ShorPublisher:Cengage Learning
 Managerial Economics & Business Strategy (Mcgraw-...EconomicsISBN:9781259290619Author:Michael Baye, Jeff PrincePublisher:McGraw-Hill Education
Principles of Economics (12th Edition)
Economics
ISBN:9780134078779
Author:Karl E. Case, Ray C. Fair, Sharon E. Oster
Publisher:PEARSON
Engineering Economy (17th Edition)
Economics
ISBN:9780134870069
Author:William G. Sullivan, Elin M. Wicks, C. Patrick Koelling
Publisher:PEARSON
Principles of Economics (MindTap Course List)
Economics
ISBN:9781305585126
Author:N. Gregory Mankiw
Publisher:Cengage Learning
Managerial Economics: A Problem Solving Approach
Economics
ISBN:9781337106665
Author:Luke M. Froeb, Brian T. McCann, Michael R. Ward, Mike Shor
Publisher:Cengage Learning
Managerial Economics & Business Strategy (Mcgraw-...
Economics
ISBN:9781259290619
Author:Michael Baye, Jeff Prince
Publisher:McGraw-Hill Education