MATLAB: An Introduction with Applications
6th Edition
ISBN: 9781119256830
Author: Amos Gilat
Publisher: John Wiley & Sons Inc
expand_more
expand_more
format_list_bulleted
Topic Video
Question
A broker believes that the average price of two bonds (Bond A and Bond B) are equal. The broker does not know the population standard deviation of the two securities. The following information outlines the information for each sample:
Stock A Stock B
n1=8 n2=13
X1=$86 X2=$94
s1=$4 s2=$12
If you count on the population variances not being equal. Test the broker's claim at the .01 level. Also, test to see whether the population variances are equal or not equal at the 0.05 level.

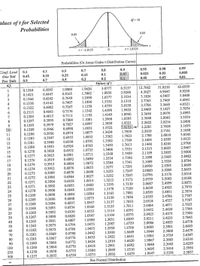
Transcribed Image Text:alues of t for Selected
df = 10
Probabilities
0.05
0.05
t=-1.8125
t= 1.8125
Probabilites (Or Areas Under t-Distribution Curve)
Conf. Level
One Tail
Two Tails
0.1
0.3
0.5
0.7
0.8
0.9
0.95
0.98
0.99
0.05
0.1
0,005
0.01
0.45
0.35
0.15
0.1
0.025
0.05
0.25
0.01
0.9
0.7
0.5
0.3
0.2
0.02
d.f.
Values of t
1.0000
0.8165
0.5095
63.6559
3.0777
1.8856
6.3137
1.9626
1.3862
1.2498
1.1896
1.1558
12.7062
4.3027
3.1824
0.1584
31.8210
0.4447
0.4242
6.9645
4.5407
3.7469
0.1421
2.9200
9.9250
0.7649
5.8408
1.6377
1.5332
2.3534
2.1318
0.1366
2.7765
2.5706
2.4469
4
0.1338
0.4142
0.7407
4.6041
0.1322
0.4082
0.7267
1.4759
2.0150
3.3649
4.0321
3.1427
2.9979
2.8965
2.8214
2.7638
2.7181
3.7074
3.4995
6.
0.4043
0.4015
0.7176
1.1342
1.9432
0.1311
0.1303
1.4398
1.8946
1.8595
1.8331
1.8125
7
0.7111
1.1192
1.4149
2.3646
0.7064
0.7027
1.3968
1.3830
1.3722
3.3554
0.1297
0.1293
8
0.3995
1.1081
2.3060
3.2498
3.1693
3.1058
3.0545
3.0123
1.0997
0.3979
0.3966
0.3956
9
2.2622
10
0.1289
0.6998
1.0931
2.2281
1.3634
1.3562
1.7959
1.7823
0.6974
1.0877
1.0832
11
0.1286
2.2010
0.3947
2.1788
2.1604
0.6955
2.6810
0.1283
0.1281
12
1.7709
0.6938
0.6924
0.6912
2.6503
2.6245
13
0.3940
1.0795
1.3502
1.7613
1.7531
1.7459
1.7396
1.7341
1.7291
1.7247
1.7207
0.3933
0.3928
0.3923
0.3919
2.9768
1.0763
1.0735
1.0711
1.0690
1.3450
2.1448
0.1280
0.1278
14
2.9467
2.9208
2.8982
15
1,3406
2.1315
2.6025
1,3368
1.3334
16
0.1277
0.6901
2.1199
2.5835
0.6892
0.6884
2.5669
2.5524
2.5395
17
0.1276
2,1098
1.0672
1.0655
1.0640
1.3304
2.1009
2.8784
18
19
0.1274
0.3915
0.1274
0.1273
1.3277
1.3253
2.0930
2.0860
2.8609
2.8453
0.3912
0.6876
2.5280
2.5176
0.6870
0.3909
0.3906
20
21
0.1272
0.6864
1.0627
1.3232
2.0796
2.8314
2.5083
2.4999
2.4922
0.3904
1.3212
1.7171
1.7139
2.0739
2.0687
2.0639
2.8188
0.6858
0.6853
0.6848
0.6844
22
0.1271
1.0614
2.8073
2.7970
1.0603
1.0593
1.0584
1.0575
1.0567
23
0.1271
0.3902
1.3195
1.3178
1.3163
1.7109
1.7081
1.7056
24
0.1270
0.3900
0.1269
2.4851
2.7874
0.3898
0.3896
25
2.0595
2.7787
2.7707
26
0.1269
0.6840
1.3150
2.0555
2.4786
1.7033
1.7011
27
0.1268
0.3894
0.6837
1.3137
2.0518
2.4727
1,3125
2.4671
2.4620
2.4573
2.0484
2.7633
0.6834
0.6830
28
0.1268
0.3893
1.0560
0.1268
0.1267
2.7564
2.7500
29
0.3892
1.0553
1.3114
1.6991
2.0452
1.3104
2.0423
0.6828
0.6807
30
0.3890
1.0547
1.6973
2.7045
2.0211
2.0086
2.0003
40
0.1265
0.3881
1.0500
1.3031
1.6839
2.4233
2.4033
2.3901
2.6778
2.6603
0.6794
1.0473
1.0455
1.2987
1.6759
1.6706
1.6669
1.6641
0.3875
0.3872
50
0.1263
1.2958
0.6786
0.6780
60
0.1262
2.3808
2.3739
2.3685
1.2938
1.9944
2.6479
1.0442
1.0432
70
0.1261
0.3869
1.2922
2.6387
0.3867
0.3866
80
0.1261
0.6776
1.9901
1.0424
1.0418
1.0386
1.0375
0.6772
1.2910
1.6620
1.9867
2.6316
0.1260
0.1260
90
1.2901
2.3642
2.6259
0.3864
0.3858
0.6770
1.6602
1.9840
100
250
0.1258
0.6755
1.2849
1.6510
1.9695
2.3414
2.5956
500
0.1257
0.3855
0.6750
1.2832
1.6479
1.9647
2.3338
2.5857
See Normal Distribution

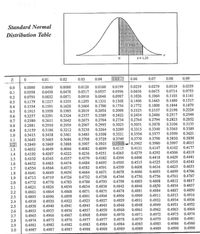
Transcribed Image Text:Standard Normal
Distribution Table
0,3944
z= 1.25
0.01
0.02
0.03
0.04
0.05
0.06
0.07
0.08
0.09
0.0160
0.0199
0.0239
0.0279
0.0319
0.0359
0.0000
0.0398
0.0
0.0040
0.0080
0.0120
0.0636
0.1026
0.0714
0.1103
0.1
0.0438
0.0478
0.0517
0.0557
0.0596
0.0675
0.0753
0.0948
0.1064
0.1141
0.0987
0.1368
0.2
0.0793
0.0832
0.0871
0.0910
0.1406
0.1443
0.1480
0.1517
0.1293
0.1664
0.1255
0.1331
0.1179
0.1554
0.3
0.1217
0.4
0.1591
0.1628
0.1700
0.1736
0.1772
0.1808
0.1844
0.1879
0.2224
0.2157
0.2486
0.2794
0.2190
0.2088
0.2422
0.5
0.1915
0.1950
0.1985
0.2019
0.2054
0.2123
0.2454·
0.2517
0.2549
0.2357
0.2673
0.6
0.2257
0.2291
0.2324
0.2389
0.7
0.2580
0.2611
0.2642
0.2704
0.2734
0.2764
0.2823
0.2852
0.3133
0.3389
0.8
0.2881
0.2910
0.2939
0.2967
0.2995
0.3023
0.3051
0.3078
0.3106
0.3315
0.3340
0.3365
0.3264
0.3508
0.9
0.3159
0.3186
0.3212
0.3238
0.3289
0.3621
0.3577
0.3790
0.3599
0.3554
0.3770
0.3461
0.3485
0.3531
0.3438
0.3665
1.0
0.3413
1.1
0.3643
0.3686
0.3708
0.3729
0.3749
0.3810
0.3830
12
0.3869
0.4049
0.3907
0.3925
0,3944
0.3962
0.3980
0.3997
0.4015
0.3849
0.3888
0.4177
0.4147
0.4292
0.4066
0.4082
0.4099
0.4115
0.4131
0.4162
0.4032
0.4192
1.3
0.4306
0.4429
0.4319
0.4279
0.4406
0.4265
0.4251
0.4382
1.4
0.4207
0.4222
0.4236
0.4418
0.4525
0.4441
0.4545
1.5
0.4332
0.4345
0.4357
0.4370
0.4394
0.4535
0.4625
*0.4495
0.4505
0.4515
0.4474
0.4573
0.4656
1.6
0.4452
0.4463
0.4484
0.4633
0.4599
0.4678
0.4616
0.4693
0.4756
0.4608
0.4591
0.4671
0.4582
0.4554
0.4641
0.4713
1.7
0.4564
0.4706
0.4767
0.4699
0.4686
:0.4750.
0.4803
1.8
0.4649
0.4664
0.4761
0.4738
0.4793
0.4744
0.4719
0.4778
0.4826
0.4732
0.4788
1.9
0.4726
0.4808
0.4812
0.4817
0.4798
0.4842
0.4772
0.4783
2.0
2.1
0.4857
0.4890
0.4854
0.4850
0.4884
0.4821
0.4830
0.4834
0.4838
0.4846
0.4887
0.4913
0.4875
0.4878
0.4881
0.4868
0.4898
2.2
0.4861
0.4864
0.4871
0.4901
0.4904
0.4906
0.4909
0.4911
0.4916
0.4896
0.4920
2.3
0.4893
0.4936
0.4952
0.4964
0.4932
0.4934
0.4931
0.4948
0.4925
0.4927
0.4929
0.4918
0.4938
0.4922
0.4941
0.4956
2.4
0.4951
0.4963
0.4946
0.4949
0.4943
0.4957
2.5
0.4940
0.4945
0.4955
0.4959
0.4960
0.4961
0.4962
0.4953
0.4965
0.4974
2.6
2.7
0.4966
0.4967
0.4968
0.4969
0.4970
0.4971
0.4972
0.4973
0.4974
2.8
0.4975
0.4976
0.4977
0.4977
0.4978
0.4979
0.4979
0.4980
0.4981
0.4986
0.4986
0.4984
0.4989
2.9
0.4981
0.4982
0.4982
0.4983
0.4984
0.4985
0.4985
3.0
0.4987
0.4987
0.4987
0.4988
0.4988
0.4989
0.4989
0.4990
0.4990
Expert Solution
This question has been solved!
Explore an expertly crafted, step-by-step solution for a thorough understanding of key concepts.
Step by stepSolved in 2 steps with 1 images

Knowledge Booster
Learn more about
Need a deep-dive on the concept behind this application? Look no further. Learn more about this topic, statistics and related others by exploring similar questions and additional content below.Similar questions
- You want to buy a washing machine, and a salesperson tells you that the mean repair costs for Model A and Model B are equal. You research the repair costs. The mean repair cost of 29 Model A washing machines is $211. Assume the population standard deviation is $15. The mean repair cost of 26 Model B washing machines is $216. Assume the population standard deviation is $25. At a = 0.01, can you reject the salesperson's claim? Assume the samples are random and independent, and the populations are normally distributed. Complete parts (a) through (e). O A The mean repair cost for Model A is greater than Model B B. The mean repair costs for Model A and Model B are equal. O C. The mean repair cost for Model A is less than Model B O D. The mean repair costs for Model A and Model B are different. Let u, be the mean repair cost for Model A and let u, be the mean repair cost for Model B. What are Ho and H,? O B. Ho: H1 =H2 Hai H1 # H2 O E. Ho: H1 # H2 OC. Ho: H1 SH2 Hai H1>H2 OF. Ho: H1ZH2 Ha:…arrow_forwardTwo accounting professors decided to test if the variance of their grades is different or no. To accomplish this, they each graded the same 10 exams with the following results: Standard Deviation 22.4 Mean Grade Professor 1 79.3 Professor 2 82.1 12.0 F What is the P-value of the test? Select one: a. between 0.01 and 0.025 Ob. between 0.025 and 0.05 C. between 0.05 and 0.10 Od. bigger than 0.10arrow_forwardSuppose the value of a stock varies each day from $10.82 to $23.17 with a uniform distribution. Find the third quartile, i.e. , 75% of all days the stock is below what value ?arrow_forward
- the weight of an organ in adult males has a bell shaped distribution with a mean of 350 grams and a standard deviation of 50 grams. use the empirical rule to determine the following a. about 99.7% of organs will be between what weights? b. what percentage of organs weighs 300 grams and 400 grams ? Plzz explain both question. Tyarrow_forwardIf the variance is 140.2, what is the Standard deviation from the following? a. 12.84 b. 15.56 c. 16.56 d. 11.84arrow_forwardlight examined data on employment and answered questions regarding why workers separate from their employes. According to the article, the standard deviation of the length of time that women with one job are employed during the first 8 years of their career is 92 weeks. Length of time employed during the first 8 years of career is a left skewed variable. For that variable, do the following tasks. A. determine the sampling distribution of the sample mean for simple random samples of 50 women with one job. Explain your reasoning B. Obtain the probability that the sampling error made in estimating the mean length of time employed by all women with one job by that of a random sample of 50 such women will be at most 20 weeksarrow_forward
- You conduct a between-subjects ANOVA investigating whether different states produce tastier cheeses. You find that eta-squared is .50. What does this tell you? a. The effect size is small. b. 50% of the total variance in tastiness is due to differences between the states. c. The difference between the group means is .50 standard deviations. d. All of the abovearrow_forwardA. Sam's times varied more over the season that Mike's times. B. Sam's times varied about the same over the season as Brett's times. C. Brett's times varied more over the season than Mike's times. D. Mike's times varied more over the season than Brett's times.arrow_forwardA survey finds that the prices paid for two-year-old Ford Fusion cars are normally distributed with a mean of $17,500.00 and a standard deviation of $500.00. Consider a sample of 10,000 people who bought two-year-old Ford Fusions. 6800 of the people who bought two-year old Ford Fusions spends between $ .00 and $ .00 How many people spends less than $17,000.00 people. How many people spends more than $19,000.00 people (Note this question has to do with the empirical rule and the symmetric nature of the normal distribution)arrow_forward
arrow_back_ios
arrow_forward_ios
Recommended textbooks for you
 MATLAB: An Introduction with ApplicationsStatisticsISBN:9781119256830Author:Amos GilatPublisher:John Wiley & Sons Inc
 Probability and Statistics for Engineering and th...StatisticsISBN:9781305251809Author:Jay L. DevorePublisher:Cengage Learning
 Statistics for The Behavioral Sciences (MindTap C...StatisticsISBN:9781305504912Author:Frederick J Gravetter, Larry B. WallnauPublisher:Cengage Learning
 Elementary Statistics: Picturing the World (7th E...StatisticsISBN:9780134683416Author:Ron Larson, Betsy FarberPublisher:PEARSON
 The Basic Practice of StatisticsStatisticsISBN:9781319042578Author:David S. Moore, William I. Notz, Michael A. FlignerPublisher:W. H. Freeman
 Introduction to the Practice of StatisticsStatisticsISBN:9781319013387Author:David S. Moore, George P. McCabe, Bruce A. CraigPublisher:W. H. Freeman

MATLAB: An Introduction with Applications
Statistics
ISBN:9781119256830
Author:Amos Gilat
Publisher:John Wiley & Sons Inc

Probability and Statistics for Engineering and th...
Statistics
ISBN:9781305251809
Author:Jay L. Devore
Publisher:Cengage Learning

Statistics for The Behavioral Sciences (MindTap C...
Statistics
ISBN:9781305504912
Author:Frederick J Gravetter, Larry B. Wallnau
Publisher:Cengage Learning

Elementary Statistics: Picturing the World (7th E...
Statistics
ISBN:9780134683416
Author:Ron Larson, Betsy Farber
Publisher:PEARSON

The Basic Practice of Statistics
Statistics
ISBN:9781319042578
Author:David S. Moore, William I. Notz, Michael A. Fligner
Publisher:W. H. Freeman

Introduction to the Practice of Statistics
Statistics
ISBN:9781319013387
Author:David S. Moore, George P. McCabe, Bruce A. Craig
Publisher:W. H. Freeman