Price Level Pz P1 AS₁ AS2 ADA AD3 AD2 AD₁ Q1 Q₂ Real Domestic Output 
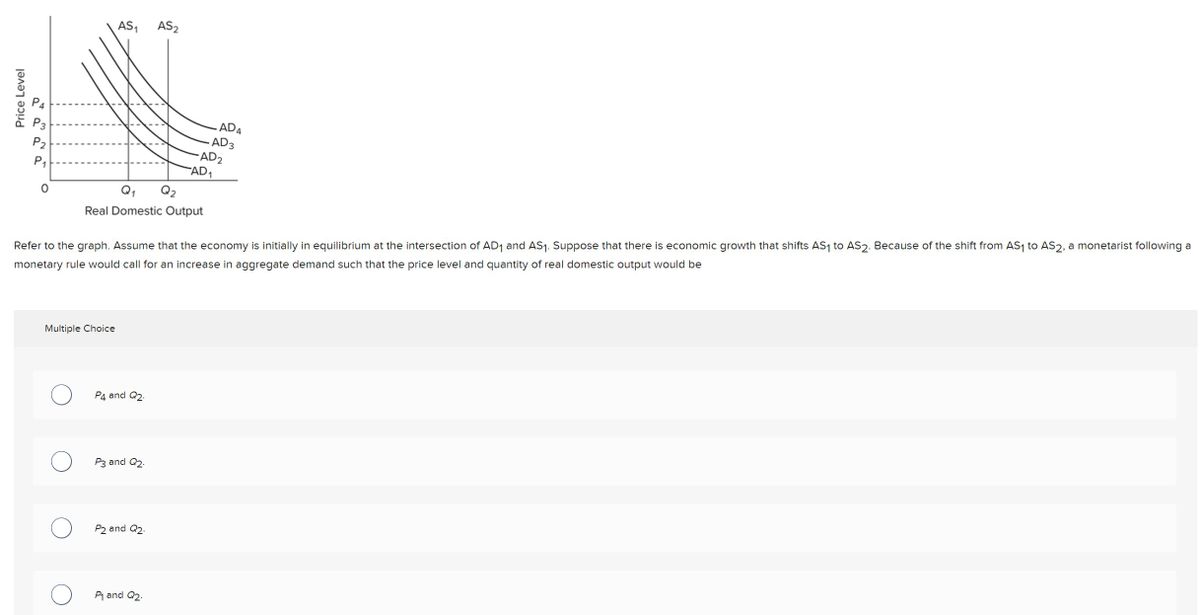
Refer to the graph. Assume that the economy is initially in equilibrium at the intersection of AD₁ and AS1. Suppose that there is economic growth that shifts AS1 to AS 2. Because of the shift from AS1 to AS2, a monetarist following a monetary rule would call for an increase in aggregate demand such that the price level and quantity of real domestic output would be Multiple Choice P4 and Q2. P3 and Q2. P2 and Q2. P₁ and Q2.
Q: profit, which means there are shops in the Given the profit-maximizing choice of output and price,…
A: A monopolistic market, also known as a pure monopoly, refers to a market structure where a single…
Q: The formula for the is curve can be derived from the formula Y = [CO+MPC(Y-T)]+1+G. When the IS…
A: The objective of the question is to derive the IS curve from the given formula and then calculate…
Q: A cookie company wants to expand its retail operations. Based on a preliminary study, 10 stores are…
A: Step 1: Given Value for Calculation Cash Flow = cf = $150Time = t = 5 YearsInitial Investment = i =…
Q: WAR WORLD II (200-300 words) choose one incident in the unfolding genocide of the jews. Then situate…
A: World War II, a global conflict that lasted from 1939 to 1945, was marked by numerous atrocities,…
Q: 2. With reference to Example 9.5.1, let R(Q) = 80Q and C(Q) = Q2 + 10Q + 900. The firm can produce…
A: Here we have to draw and analyse the profit maximizing output of the firm.The costs a company…
Q: Please provide me with the correct answer, along with the calculations, and do not use any AI tools
A: Step 1: Write the regression equation for the regression equation that estimates costs for the next…
Q: Which of the following statements is true regarding a Section 1035 exchange of life insurance…
A: Insurance is a contractual arrangement in which an individual or entity (the insured) pays a premium…
Q: (Harder) Can you come up with gross profit levels II and II such that for the unobservable effort…
A: The gross profit level is given as , such that for any unobservable effort, the principle implements…
Q: Directions: In the space provided, draw supply and demand for each of the following prompts. Label…
A: Supply and demand are fundamental concepts in economics that describe the behavior of sellers and…
Q: Exhibit Economic Adjustments if the economy is at point a, Group of answer choices employment is…
A: The topic described in the question is related to the money market in economics, which is the…
Q: What is the difference between a & b? Why? Compare inflation for 1970s and 1980s. Any improvement in…
A: Macroeconomics examines the working, composition, and dynamics of an economy. To comprehend and…
Q: What point represents a recession? What point represents an unattainable point without trade or…
A: PPC: Graphical representation of the combination of two goods that can be produced in the economy in…
Q: Based on the table below, what is the optimal Level of Activity? Total benefit Total cost Level of…
A: Let's analyze the provided table to find the optimal level of activity.Optimal Level of Activity…
Q: The table below shows Fiona's marginal utility for hot dogs and peanuts at each quantity. What is…
A: The objective of the question is to calculate Fiona's total utility for consuming 4 hot dogs and 3…
Q: A natural gas company has a low average total cost due to its large scale production. The initial…
A: The objective of the question is to identify the correct barrier to entry that explains why the…
Q: Suppose a farmer in Georgia begins to grow peaches. He uses $1,000,000 in savings to purchase land,…
A: Economic profit takes into account all of a business's operating expenses, going beyond simply…
Q: During the Middle-Ages, the African city of Taghaza (located in modern day Mali and known as one of…
A: Elasticity of demand measures how responsive people are to price changes for a particular good. In…
Q: The following table pertains to Pieway, an economy in which the typical consumer's basket consists…
A: The objective of the question is to calculate the inflation rate in Year 2, using Year 1 as the base…
Q: H L H 12, 8 2, 3 L 3,2 4, 4 The numbers in each cell of the matrix above, (m₁, m2), represents…
A: “Since you have asked multiple question, we will solve the first question for you. If you want any…
Q: Consider the following two economies: t = 1; 2. u(c) = log(c). = 1. delta = 1. F(K) = KO:5. K1 = 1 t…
A: Total utility refers to the overall satisfaction or happiness that an individual or a collection of…
Q: (a) Gwyneth is conducting research into consumer behaviour. She has decided to use the utility…
A: i hope you got the concept. if you feel like having any doubt in any part of the question then feel…
Q: Note:- Do not provide handwritten solution. Maintain accuracy and quality in your answer. Take care…
A: The objective of the question is to calculate the Marginal Product (MP) and Average Product (AP) for…
Q: A consumer is currently purchasing three pairs of jeans and five T-shirts per year. The price of…
A: Consumer equilibrium: A consumer attains equilibrium at a point where the per-dollar marginal…
Q: Now assume that, starting from the optimal point in d), your wage increases to £18 per hour. Explain…
A: The question mentions to solve part e. To solve part e, part d is also required ot be solved. Hence…
Q: The graph shows a firm's average product curve. Draw the firm's marginal product curve. Label it.…
A: Product marginal, in this context, is concerned with the quantity of an outcome acquired by a firm…
Q: None
A: Here's why:Overnight rate is the interest rate at which banks lend money to each other overnight.By…
Q: eBook Harrimon Industries bonds have 5 years left to maturity. Interest is paid annually, and the…
A: Question:What is the yield to maturity at a current market price ofWhat is the yield to maturity at…
Q: Data on the distribution of income for the United States show that from 1970 through 2014, the share…
A: The distribution of income refers to how a country's total economic output (GDP) is divided amongst…
Q: Banks find it necessary to accommodate their clients’ needs to buy or sell FX forward, in many…
A: Forward transactions in foreign exchange (FX) markets involve agreements between parties to buy or…
Q: Consider a small country. The domestic (home) demand is Qd = 120−3P and supply is Qs = 2P −20…
A: A) Finding Equilibrium with Import QuotaWhen a quota is imposed on imports, it restricts the total…
Q: 3. What is a significant difference between rational and adaptive expectations? A. Rational…
A: The objective of the first part of the question is to understand the key differences between…
Q: Use the photo at exercise 14 to solve the problem below With the Firm Y response function…
A: The game of Stackelberg, two players with the leading and trailing firms function in the market,…
Q: A bag factory produces 40 units of output. Its average variable cost (AVC) = $23, average total cost…
A: The bag factory produces 40 units of output.The average variable cost is $23. The average total cost…
Q: From the data shown, determine the economic service life of the asset.
A: Economic service life isn't just how long something functions, but rather the period it remains…
Q: Demand-pull inflation occurs when: A) Costs of production decrease B) Aggregate demand exceeds…
A: To understand demand-pull inflation, it's crucial to grasp the relationship between aggregate demand…
Q: The following grJaph plots a supply curve fir some hypothetical good. For each if these reasons use…
A: The supply curve may be analyzed to find the elasticity at various locations. This is computed with…
Q: Suppose you have been tasked with regulating a single monopoly firm that sells 50-pound bags of…
A: The average total cost is the cost per unit produced which can be calculated by dividing the total…
Q: 160- Exchange rate (yen per U.S. dollar) The graph shows the demand curve for U.S. dollars. Draw a…
A: The U.S. interest rate differential refers to the difference in interest rates between the United…
Q: You've estimated the following expected returns for a stock, depending on the strength of the…
A: Investors look at the expected return to gauge what they might make from an investment. It's…
Q: Question 4 of 4 The graph shows the demand for money curve. On the graph, draw the supply of money…
A: It depicts the correlation between the quantity(Q) of money people want to hold and the interest…
Q: A monopoly can sell 20 units of output for $18 per unit. Alternatively it can sell 21 units of…
A: The objective of this question is to calculate the marginal revenue of the 21st unit of output for a…
Q: When should a firm exit the market in the long run
A: Firm entry and exit refers to the process in which new companies enter a market to sell products or…
Q: Complete the following table by computing the percentage change in price for each of the three…
A: Consumer price index:CPI refers to the change in price based totally on the basket of goods and…
Q: Tanaka Industrial Systems Company is trying to decide between two different conveyor belt systems.…
A: Equivalent Annual Cost (EAC) is a financial metric used to compare the costs of alternative…
Q: FOR QUESTION NUMBER 21 AND 22 Determine feasibility of the project using IRR and ERR of the project.…
A: Annual Cash Flow = Annual Receipts - Annual ExpensesAnnual Cash Flow = PhP 8,000 - PhP 4,000 = PhP…
Q: Consider an economy with three sectors, Chemicals & Metals, Fuels & Power, and Machinery. Chemicals…
A: The exchange table depicts the distribution of inputs and outputs among different sectors. It shows…
Q: Ex. 5- - Agenda Setting An agenda-setting game is described as follows. The "issue space" (set of…
A:
Q: Equipment associated with manufacturing small railcars had a first cost of $190000 with an expected…
A: The objective of the question is to calculate the difference in taxes paid in year 2 if the…
Q: None
A: Answer: In a monopolistically competitive market, firms produce where marginal revenue (MR) equals…
Q: 3. Assume ao =0 and w, w+&, where & are independent, identically distributed shocks that take value…
A: A utility function represents a mathematical representation of an individual's preferences over…
Step by step
Solved in 2 steps
- Look at Figure 2. Assume this aggregate demand diagram represents an economy with government, where: a = exogenous consumption b = the marginal propensity to consume t = the tax rate |= investment G = government spending Y = income Figure 2 Aggregate demand AD, AD. 45° Income What is the equation for the aggregate demand schedule ADo? Select one: O ADO = b+ a(1 - t)G +1+ Y O ADO = a + b(1 – 1)Y + 1+ G O ADO = a + b(1 - t) I+ Y+ G O ADO = b+ a(1 – 1)Y + /+ G Next page > ( Previous page PHILIPSThe graph below depicts an increase in aggregate demand due to an increase in net exports. This increase in aggregate demand is depicted as a shift from AD to AD₁. Price Level LRAS X AD Real GDP AS AD Tools AS, 0 a. In the long run, aggregate supply will adjust to move the economy back to the full-employment level of output. Show this shift using the graph above. Instructions: Use the tool provided "AS₁" to show the movement back to full-employment output. Plot only the endpoints of the line, keeping AS, parallel to AS with the appropriate Intersection (2 points total). b. How does the new long-run equilibrium compare to the Initial full-employment level before the Increase in net exports? O The price level is higher, but output is lower. O The price level is lower, but output remains the same. O The price level is lower, but output is higher. O The price level is higher, but output remains the same.Refer to the information provided in Figure below to answer the question(s) that follow. AS2 AS1 ASo AD1 Y Y2 Y Yo Aggregate output Figure Refer to Figure Assume the economy is at Point A. Lower oil prices shift the aggregate supply curve to ASO. If the government decides to counter the effects of lower oil prices by decreasıng government spending, then the price level will be than Po and output will be than Y0- Select one: a. greater; greater b. less; less C. greater; less d. less; greater Price level
- suppose a Keynesian macroeconomic model is characterized with the following equations: Y = C + I + G Goods markets C = C = 320 + 0.8YdYd = Y − TI = 40 − 40rG = 80T = 50 Money marketsMoney demand:(M/P)d = 500 + 0.8 − rMoney supply: MSP = 800Derive IS and LM equations and derive equilibrium income level and interest rate.In the year 2020, aggregate demand and aggregate supply in the fictional country of Drooble are represented by the curves AD2020AD2020 and AS on the following graph. The price level is 102. The graph also shows two possible outcomes for 2021. The first potential aggregate demand curve is given by the ADAADA curve, resulting in the outcome illustrated by point A. The second potential aggregate demand curve is given by the ADBADB curve, resulting in the outcome illus- trated by point B. PRICE LEVEL 108 107 106 105 104 103 102 101 100 0 AD 2020 2 ■ 4 B AS 6 8 10 OUTPUT (Trillions of dollars) ADA ADB 12 14 16 ? Suppose the unemployment rate is 6% under one of these two outcomes and 5% under the other. Based on the previous graph, you would expect to be associated with the higher unemployment rate (6%). If aggregate demand is low in 2021, and the economy is at outcome A, the inflation rate between 2020 and 2021 is Based on your answers to the previous questions, on the following graph use…Assume that an economy is initially operating at the natural rate of output (full employmentoutput). Use the AD-AS model to illustrate graphically the effects on price and output of anincrease in government spending. Explain your assumptions with respect to the range ofaggregate supply of your analysis.
- The following is an aggregate demand and aggregate supply model. ASLA AS2 AS, P3 P2 AD2 AD1 Q, Real output Assume that the economy is initially in equilibrium at AD1 and AS1 and the real domestic output will be (b) If there is demand pull inflation, then in the short run, the new equilibrium is at point and real domestic output at, (c) In the long run, the nominal wages will rise so that aggregate supply curve shifts from The new equilibrium will be at point (a) The Price level will be with the price level at with the price level at _to _and real domestic output at so the increase in the aggregate demand has only moved the economy along its, (d) Assume that the economy is now initially at equilibrium point W, where the AD 1 intersects the AS1. If there is cost push inflation then: a. In the short run, the new equilibrium point is at point curve. the price level at and real domestic output at, Price levelSuppose that you have an AEF at a price level of p = $100 given by: AEF = 1,200+ 0.40Y Suppose also that for every $1 increase in the price level, desired consumtion decreases by $1. Given this, what is the slope of Aggregate Demand (AD) in the AD-AS model? Note: round your answers to three decimal places.1. Consider the following simple Keynesian model, (i) Rewrite the model into matrix form with Y, C and I as endogenous variables and Go and i as exogenous variables. (The coefficient matrix must be a 3 by 3 matrix.) Y=C+I+Go C = 200+ 0.8Y I= 1000-2000 (ii) Compute the equilibria Y*, C* and I* as functions of Go and i using Cramer's rule. 8Y* (iii) Find and di ƏY* ƏGo (iv) Give an economic interpretation of national income? ƏY* " ƏGo what should the government do if it wants to raise
- Assume that an economy is initially operating at the natural rate of output (full employmentoutput). Use the AD-AS model to illustrate graphically the effects on price and output of areduction in government spending. Explain your assumptions with respect to the range ofaggregate supply of your analysis.A decrease in the price level: a b с Price Level (P) d P2 P₁ a bg Select an answer and submit. For keyboard navigation, use the up/down arrow keys to select an answer. Q₁ Q₂ AD AD* Real GDP (Q) is illustrated by a movement along the AD curve from point a to b, and leads to an increase in aggregate demand. is illustrated by a movement along the AD curve from point a to b, and leads to an increase in the quantity demanded of real GDP. results in a shift of the AD curve to the right, such as going from point b on AD to point g on AD*. results in a shift of the AD curve to the left, such as going from point f on AD* to point a on AD.Price Level 0 AS₁ a ASO b c Real GDP Refer to the figure above. If aggregate supply is AS, and aggregate demand is ADo, then: a surplus of real output of gh yould f represents a price level that would result in a surplus of real output of ac f represents a price level that would result in a shortage of real output of ac f represents a price level that would result in a surplus of real output of a at any price level above g. a shortage of real output would occur occur