
ENGR.ECONOMIC ANALYSIS
14th Edition
ISBN: 9780190931919
Author: NEWNAN
Publisher: Oxford University Press
expand_more
expand_more
format_list_bulleted
Related questions
Question

Transcribed Image Text:Price level (GDP deflator, 2009 = 100)
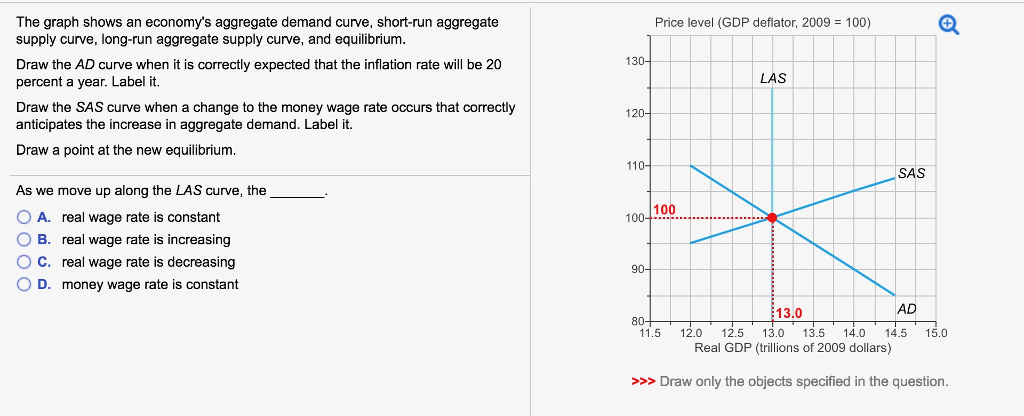
The graph shows an economy's aggregate demand curve, short-run aggregate
supply curve, long-run aggregate supply curve, and equilibrium.
Draw the AD curve when it is correctly expected that the inflation rate will be 20
percent a year. Label it.
Draw the SAS curve when a change to the money wage rate occurs that correctly
anticipates the increase in aggregate demand. Label it.
Draw a point at the new equilibrium.
As we move up along the LAS curve, the
A. real wage rate is constant
B. real wage rate is increasing
C. real wage rate is decreasing
D. money wage rate is constant
130-
120-
110-
100
100-
90-
LAS
13.0
SAS
0
AD
80-
11.5
12.0 12.5 13.0 13.5 14.0 14.5 15.0
Real GDP (trillions of 2009 dollars)
>>> Draw only the objects specified in the question.
Expert Solution
This question has been solved!
Explore an expertly crafted, step-by-step solution for a thorough understanding of key concepts.

This is a popular solution

Trending nowThis is a popular solution!

Step by stepSolved in 2 steps with 1 images

Knowledge Booster

Similar questions
- Deflation is particularly bad for an economy in recession for all of the following reasons EXCEPT a-with deflation people spend less expecting prices to be lower in the future b- the rising prices makes goods more expensive c- with deflation the value of assets declines while the value of loans does not - this lowers wealth and further depresses spendingarrow_forwardThe following graph represents the short-run aggregate supply curve (SRAS) based on an expected price level of 120. The economy's full- employment output level is $9 trillion. Major unions across the country have recently negotiated three-year wage contracts with employers. The wage contracts are based on an expected price level of 120, but the actual price level turns out to be 160. Show the short-run effect of the unexpectedly high price level by dragging the curve or moving the point to the appropriate position. PRICE LEVEL (CPI) 240 200 160 40 0 0 3 SRAS[120] 6 9 12 REAL GDP (Trillions of dollars) 15 18 SRAS[120] 0 (?) Interpret the change you drew on the previous graph by filling in the blanks in the following paragraph:arrow_forwardIn order to improve the living standards of the people in Philippines after the devastating typhoon Haiyan, the government decided to increase the labour wage per hour from AUD 17.50 to AUD 25.00. Also, Philippines experienced structural unemployment and frictional unemployment. The figure below indicates that the aggregate demand curve slopes left to right downwards. 1)Explain the factors that account for the shape of the Aggregate demand curve. Graph:arrow_forward
- There is a decrease in wealth what will happen to price level and real GDParrow_forwardExplain two ways in which a recession might raise the natural rate of unemployment (Macroeconomics field of question)arrow_forwardStart at full-employment (FE) equilibrium with flexible wages and worker misperception of price level changes in the short run. Suppose then that we have an increase in Aggregate Demand. First, think about the short-run effects on price level (P), output level (Q), wage level (W), employment (L), and unemployment (U)? In the long run, once workers realize that there was a change in the price level, they will change the supply curve of labor. When all subsequent wage and price adjustments take place, we will be in a new long-run equilibrium. From the original full-employment (FE) equilibrium to the final one, what is the net change in the price level (P), output level (Q), the nominal wage (W), employment (L), unemployment rate (U), and the real wage (W/P)? Group of answer choices a) An increase in P, no change in Q, no change in W, an increase in L, an increase in U and no change in W/P. b) An increase in P, a decrease in Q, a decrease in W, a decrease in L, an…arrow_forward
- Explain each of the following in terms of how changes in the price level and the effect on Aggregate Quantity Demanded: The Real Balances Effect (in your text this is referred to as the Wealth Effect) The Interest Rate effect The Foreign Purchases effect (in your text this is referred to as the Foreign Prices effect)arrow_forwardThe graph shows the aggregate demand (AD) curve and the long-run aggregate supply (LRAS) curve for a hypothetical economy. Suppose that the economy observes an increase in the human capital of workers, causing productivity to rise. Show the effect of this change by shifting one of the curves in the graph. LRAS How will this change affect the rate of inflation? Inflation will fall Inflation will rise, Inflation will be unchanged. AD How will this change affect the growth rate? Real GDP growth rate The growth rate will decrease. The growth rate will increase. The growth rate will be unchanged.arrow_forwardPrice Level LRAS I о, он ог Real GDP SRAS, SRAS SRAS₂ ON=Natural Real GDP AD Refer to Figure 9-3. If the economy is in short-run equilibrium at point C, the (actual) unemployment rate is less than the natural unemployment rate. the (actual) unemployment rate is equal to the natural unemployment rate. the (actual) unemployment rate is greater than the natural unemployment rate. the relationship between the (actual) unemployment rate and the natural unemployment rate cannot be determined from the available information.arrow_forward
- Q1. Phillip's Curve: For each of the following draw an AD-AS diagram and a corresponding Phillip's curve assuming the following: (1) actual RGDP is $9,200 (2) full employment RGDP is $10,000 (3) the natural rate of unemployment is 5%; (4) actual unemployment fluctuates around 5% a. Show in both diagrams the effect of an increase in government purchases that pushes actual RGDP up to full employment b. Again assume actual GDP is at $9,200, show in both diagrams the effect of the Federal Reserve bank selling versus buying treasury bonds to banks. c. Again assume actual GDP is at $9,200, show in both diagrams the effect of self-correction mechanism.arrow_forwardBecause the long-term trend has been for prices to rise, adjusting Nominal GDP to Real GDP involves inflating the lower prices before the base year and deflating the higher prices after the base year. 1) True 2) Falsearrow_forwardA futures market trades contracts on the growth rate for nominal GDP. The contract pays $X to the buyer, where X is 100 times the growth rate in nominal GDP from last year to this year. For example, if nominal GDP grows by 1% over last year, the contract pays $100 (1 x 100). Nominal GDP last year was $28,909 billion. Contracts on the futures markets are currently selling for $513. What is the market's prediction for nominal GDP this year? Put your answer in billions. You may round to two decimal places.arrow_forward
arrow_back_ios
SEE MORE QUESTIONS
arrow_forward_ios
Recommended textbooks for you
 Principles of Economics (12th Edition)EconomicsISBN:9780134078779Author:Karl E. Case, Ray C. Fair, Sharon E. OsterPublisher:PEARSON
 Engineering Economy (17th Edition)EconomicsISBN:9780134870069Author:William G. Sullivan, Elin M. Wicks, C. Patrick KoellingPublisher:PEARSON
 Principles of Economics (MindTap Course List)EconomicsISBN:9781305585126Author:N. Gregory MankiwPublisher:Cengage Learning
 Managerial Economics: A Problem Solving ApproachEconomicsISBN:9781337106665Author:Luke M. Froeb, Brian T. McCann, Michael R. Ward, Mike ShorPublisher:Cengage Learning
 Managerial Economics & Business Strategy (Mcgraw-...EconomicsISBN:9781259290619Author:Michael Baye, Jeff PrincePublisher:McGraw-Hill Education
Principles of Economics (12th Edition)
Economics
ISBN:9780134078779
Author:Karl E. Case, Ray C. Fair, Sharon E. Oster
Publisher:PEARSON
Engineering Economy (17th Edition)
Economics
ISBN:9780134870069
Author:William G. Sullivan, Elin M. Wicks, C. Patrick Koelling
Publisher:PEARSON
Principles of Economics (MindTap Course List)
Economics
ISBN:9781305585126
Author:N. Gregory Mankiw
Publisher:Cengage Learning
Managerial Economics: A Problem Solving Approach
Economics
ISBN:9781337106665
Author:Luke M. Froeb, Brian T. McCann, Michael R. Ward, Mike Shor
Publisher:Cengage Learning
Managerial Economics & Business Strategy (Mcgraw-...
Economics
ISBN:9781259290619
Author:Michael Baye, Jeff Prince
Publisher:McGraw-Hill Education