ENGR.ECONOMIC ANALYSIS
14th Edition
ISBN: 9780190931919
Author: NEWNAN
Publisher: Oxford University Press
expand_more
expand_more
format_list_bulleted
Question

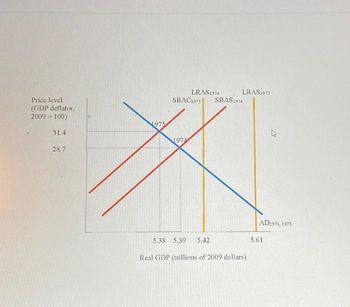
Transcribed Image Text:Price level
(GDP deflator,
2009 = 100)
31.4
28.7
1975
1974
LRAS1974
SRAC1975 SRAS1974
5.38 5.39
LRAS1975
5.42
Real GDP (trillions of 2009 dollars)
AD1974, 1975
5.61

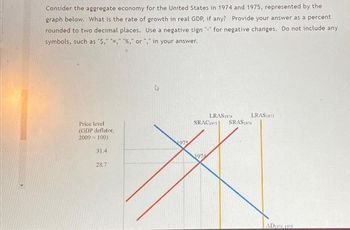
Transcribed Image Text:Consider the aggregate economy for the United States in 1974 and 1975, represented by the
graph below. What is the rate of growth in real GDP, if any? Provide your answer as a percent
rounded to two decimal places. Use a negative sign "-" for negative changes. Do not include any
symbols, such as "$," "," "%," or "," in your answer.
Price level
(GDP deflator,
2009-100)
31.4
28.7
1975
LRASI
SRACI
197
SRASI
LRAS197
AD
Expert Solution
This question has been solved!
Explore an expertly crafted, step-by-step solution for a thorough understanding of key concepts.
This is a popular solution
Trending nowThis is a popular solution!
Step by stepSolved in 3 steps with 1 images

Knowledge Booster
Learn more about
Need a deep-dive on the concept behind this application? Look no further. Learn more about this topic, economics and related others by exploring similar questions and additional content below.Similar questions
- 4.arrow_forwardA simple economy produces two goods, Apple Pies and Software. Price and quantity data are as follows: Production and Prices in Year 1 (Base year) Quantity 115 600 Product Apple Pies Software Price Per Unit Production and Prices in Year 2 Quantity 143.75 900.00 Product Apple Pies Software In Year 2, nominal GDP is equal to: $ and real GDP is $ $2.50 $60.00 Price Per Unit $3.75 $120.00 (enter both responses rounded to the nearest penny).arrow_forwardSolve d and e onlysarrow_forward
- Question 1: In an economy, there are only two goods (Cars and cycles) produced. The data for last three years is given in the below table. Calculate the nominal and real GDP of three years and then find the GDP deflator for all the three years. Find year on year (YoY) inflation for 2018 and 2019. Note: the base year for this economy is given as 2017. year Price of Car (AED) Number of Car Price of cycle (AED) Number of cycle 2017 1000 10 200 900 2018 1200 15 210 1000 2019 1500 25 250 1500 Question 2: Explain the role of fiscal and monetary policy in an economy facing a recession. Use appropriate graph to justify your answerarrow_forwardTable 23.1: Vital Economic Statistics for An Earthly Economy Nominal RGDP Total GDP Price Population Year ($ Billion) Index (in Million) 7 $5,000.00 119 129.00 6. $4,900.00 117 128.50 5. $4,950.00 114 128.16 4 $4,890.00 110 127.45 Refer to Table 23.1. Real GDP per person dropped by about in Year 6. O 3.50% 3.80% O 3.70% 3.60%arrow_forwardConsider the following national accounts data for Westeros: Westeros' National Accounts (2019) GDP Item (S billions) Corporate income 140 Еxports 50 Wages and salaries 550 Net international income to the rest of the 8 world Gross investment 160 Government purchases 184 Indirect taxes 75 Personal consumption 500 Imports 27 Depreciation 79 Proprietors' incomes and rents Which is the following is the income-based estimate of GDP for Westeros? 65 $909 billion $751 billion $558 billion $939 billionarrow_forward
- You are given the following: Year Quantity of Cars Price of Cars Quantity of Buses Price of Buses 2013 5 million $20,000 1 million $100,000 2014 5.1 million $22,000 1.2 million $102,000 Base Year = 2013 2a. Calculate nominal GDP for 2013. Nominal GDP for 2013 = (5 million × $20,000) + (1 million × $100,000) = $100,000 million + $100,000 million = $200,000 million 2b. Calculate nominal GDP for 2014. Nominal GDP for 2014 = (5.1 million × $22,000) + (1.2 million × $102,000) = $112,200 million + $122,400 million = $234,600 million. 2c. Calculate real GDP for 2014. The real GDP for 2014 will be calculated as:- Real GDP for 2014 = (5.1 million × $20,000) + (1.2 million × $100,000) = $102,000 million + $120,000 million = $222,000 million. 2d. Calculate the GDP Deflator to the nearest tenth for 2014. 2e. What does your previous number mean? 2f. Calculate the CPI to the nearest tenth for 2014. (Use 2013 as the base year.)arrow_forwardHow would I calculate the real GDP increase between the years 2013 and 2003? 2003: Nominal GDP (Billions)- 10,960 Price Index: 82.6 2013: Nominal GDP (Billions)- 16,768 Price index: 101.8arrow_forwardUse the table below to answer the following questions. Nominal GDP (billions) 600 Year GDP deflator 2000 100.0 2005 1,000 133.3 13) Between 2000 and 2005, the general level of prices increased by approximately 16.7 percent. 33.3 percent. 66.7 рercent. 133.3 percent. а. b. с. d. 14) Measured in terms of 2000 prices, real GDP in 2005 was а. 600. b. 750. 900. с. d. 1,333.arrow_forward
- I. Based on the data in Table 2 below, calculate Indonesia's 2011-2016 by measuring changes in the GDP Deflator. Table 2.Indonesia's Gross Domestic Product 2011-2016 year Product Domestik Bruto (Miliar Rp.) Nominal IHK (%) Deflator 2010 6,864,133.1 6.96 100.0 2011 7,831,726.0 3.79 107.5 2012 8,615,704.5 4.30 111.5 2013 9,546,134.0 8.38 117.0 2014 10,569,705.3 8.36 123.4 2015 11,531,716.9 3.35 128.4 2016 12,406,809.8 3.02 131.5arrow_forwardGross Domestic Product If nominal GDP in 1975 was $1699.9 billion and the GDP deflator (price index) was 100, what is the value of real GDP in 1975?arrow_forwardAssume an economy consumes only two goods: food and clothing. The prices and quantities produced domestically of each good for two different years are shown in the table below. Year 1 quantity Year 2 quantity Year 1 price Year 2 price Food 5000 5500 $2 $5 Clothing 1000 1200 $30 $25 What is the nominal GDP for year 2? What is the real GDP for year 2, using year 1 as the base year? What is the GDP deflator? (2 decimal places) What was the result on the overall price level? no ch increased decreasedarrow_forward
arrow_back_ios
SEE MORE QUESTIONS
arrow_forward_ios
Recommended textbooks for you

 Principles of Economics (12th Edition)EconomicsISBN:9780134078779Author:Karl E. Case, Ray C. Fair, Sharon E. OsterPublisher:PEARSON
 Engineering Economy (17th Edition)EconomicsISBN:9780134870069Author:William G. Sullivan, Elin M. Wicks, C. Patrick KoellingPublisher:PEARSON
 Principles of Economics (MindTap Course List)EconomicsISBN:9781305585126Author:N. Gregory MankiwPublisher:Cengage Learning
 Managerial Economics: A Problem Solving ApproachEconomicsISBN:9781337106665Author:Luke M. Froeb, Brian T. McCann, Michael R. Ward, Mike ShorPublisher:Cengage Learning
 Managerial Economics & Business Strategy (Mcgraw-...EconomicsISBN:9781259290619Author:Michael Baye, Jeff PrincePublisher:McGraw-Hill Education


Principles of Economics (12th Edition)
Economics
ISBN:9780134078779
Author:Karl E. Case, Ray C. Fair, Sharon E. Oster
Publisher:PEARSON

Engineering Economy (17th Edition)
Economics
ISBN:9780134870069
Author:William G. Sullivan, Elin M. Wicks, C. Patrick Koelling
Publisher:PEARSON

Principles of Economics (MindTap Course List)
Economics
ISBN:9781305585126
Author:N. Gregory Mankiw
Publisher:Cengage Learning

Managerial Economics: A Problem Solving Approach
Economics
ISBN:9781337106665
Author:Luke M. Froeb, Brian T. McCann, Michael R. Ward, Mike Shor
Publisher:Cengage Learning

Managerial Economics & Business Strategy (Mcgraw-...
Economics
ISBN:9781259290619
Author:Michael Baye, Jeff Prince
Publisher:McGraw-Hill Education