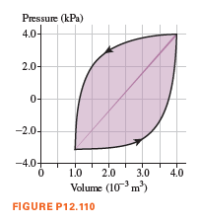
We’ve seen that the area under a pV graph is the work done in an ideal-gas process. If the process follows a closed curve, the work is the area inside the curve. The graph as shown the gauge pressure in the lungs versus the volume of gas in the lungs for a person who is taking rapid, deep breaths. During one complete breath, the pressure-versus-volume data trace out the curve shown, in the direction of the arrows. The energy expended in one complete breath is represented by the shaded area inside the curve. If you graph pressure-versus-volume data for normal breathing, the upper and lower lines are much closer together and the volume range is much smaller.
For the graph in the figure, approximately how much energy is required for one complete breath?
A. 5 J B. 15 J
C. 25 J D. 35 J

Trending nowThis is a popular solution!
Step by stepSolved in 2 steps

- An engine is design to run at 72% of Carnot engine efficiency with high and low temperature of 798 K and 293 K. The engine’s lower reservoir is at 8510 J. What is the work that can be delivered by the engine?arrow_forwardA gas expands from I to F in the figure below. The energy added to the gas by heat is 302 J when the gas goes from I to Falong the diagonal path. Three paths are plotted on a PV diagram, which has a horizontal axis labeled V(liters), and a vertical axis labeled P (atm). The green path starts at point I (2,4), extends vertically down to point B(2,1), then extends horizontally to point F (4,1). The blue path starts at point I (2,4), and extends down and to the right to end at point F (4,1). The orange path starts at point I(2,4), extends horizontally to the right to point A (4,4), then extends vertically down to end at point F(4,1). (a) What is the change in internal energy of the gas?J(b) How much energy must be added to the gas by heat for the indirect path IAF to give the same change in internal energy?Jarrow_forwardWhat is the Carnot efficiency of a heat engine operating between the temperatures of 10 C and 100C? Include Units .arrow_forward
- One mole of an ideal gas is used as the working substance of an engine operating in the cycle shown in the figure below. BC and DA processes are reversible adiabatic.a) Is the gas monoatomic, diatomic or triatomic?b) What is the efficiency and engine?arrow_forwardFor the two PV diagrams below, find the net work done on the gas during the process indicated by the path. (Enter your answers in J.)arrow_forwardA power plant operates at a 25.0% efficiency during the summer when the seawater used for cooling is at 20.0°C. The plant uses 360°C steam to drive turbines. If the plant's efficiency changes in the same proportion as the ideal efficiency, what would be the plant's efficiency in the winter, when the seawater is at 10.1°C? ______ %arrow_forward
- A thermodynamic process can be represented using a PV diagram where the pressure and volume at every stage is recorded. In the thermodynamic process shown below the work done by the system is РА A O the area under the PV curve and positive the area under the PV curve and negative B is the product of the change in volume during the process and the change in pressure. cannot be found from the PV grapharrow_forwardSuppose a heat engine design makes a square on a PV diagram, using a monatomic gas. The high pressure is 3P and low pressure is P. The high volume is 3V and low volume is V. What is the efficiency of the heat engine?arrow_forwardPlease describe to me the laws of thermodynamics. There are a certain number of them and therefore you must have all of them. Each should be labeled with it's number. For instance "The First Law of thermodynamics says that..."arrow_forward
- A sample of ideal gas in a thermally insulated container with a movable piston is initially in state A. The gas is taken from state A to state B by an adiabatic process. The dashed lines represent isotherms. If W is the work done on the gas, Q is the energy transferred to the gas by heating, and Delta U be the change in the internal energy of the gas during the process. a) is W greater than zero, zero, or less than zero? Explain briefly b) is Q greater than zero, zero, or less than zero? Explain briefly. c) is Delta U greater than zero, zero, or less than zero? Explain briefly.arrow_forwardNeeds Complete typed solution with 100 % accuracy.arrow_forwardA Carnot engine has a power output of 205 kW. The engine operates between two reservoirs at 8°C and 460°C. How much thermal energy is absorbed each hour? Answer in units of J.arrow_forward
 College PhysicsPhysicsISBN:9781305952300Author:Raymond A. Serway, Chris VuillePublisher:Cengage Learning
 University Physics (14th Edition)PhysicsISBN:9780133969290Author:Hugh D. Young, Roger A. FreedmanPublisher:PEARSON
 Introduction To Quantum MechanicsPhysicsISBN:9781107189638Author:Griffiths, David J., Schroeter, Darrell F.Publisher:Cambridge University Press
 Physics for Scientists and EngineersPhysicsISBN:9781337553278Author:Raymond A. Serway, John W. JewettPublisher:Cengage Learning
 Lecture- Tutorials for Introductory AstronomyPhysicsISBN:9780321820464Author:Edward E. Prather, Tim P. Slater, Jeff P. Adams, Gina BrissendenPublisher:Addison-Wesley
 College Physics: A Strategic Approach (4th Editio...PhysicsISBN:9780134609034Author:Randall D. Knight (Professor Emeritus), Brian Jones, Stuart FieldPublisher:PEARSON


