FINANCIAL ACCOUNTING
10th Edition
ISBN: 9781259964947
Author: Libby
Publisher: MCG
expand_more
expand_more
format_list_bulleted
Question
tuejejjeh3h

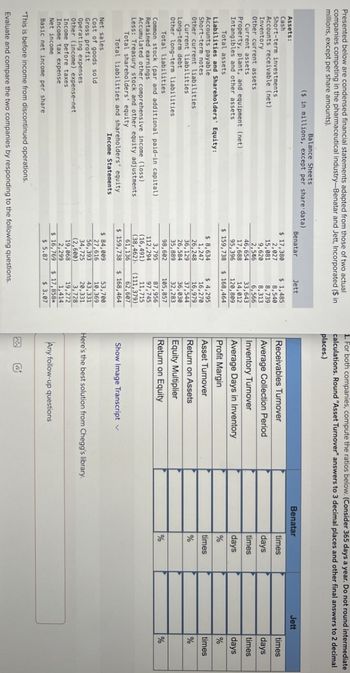
Transcribed Image Text:Presented below are condensed financial statements adapted from those of two actual
companies competing in the pharmaceutical industry-Benatar and Jett, Incorporated ($ in
millions, except per share amounts).
Balance Sheets
($ in millions, except per share data)
1. For both companies, compute the ratios below. (Consider 365 days a year. Do not round intermediate
calculations. Round "Asset Turnover" answers to 3 decimal places and other final answers to 2 decimal
places.)
Assets:
Cash
Short-term investments
Accounts receivable (net)
Inventory
Other current assets
Current assets
Property, plant, and equipment (net)
Intangibles and other assets
Total assets
Liabilities and Shareholders' Equity:
Accounts payable
Short-term notes
Other current liabilities
Current liabilities
Long-term debt
Other long-term liabilities
Total liabilities
Benatar
Jett
Benatar
Jett
$ 17,380
$ 1,485
Receivables Turnover
times
2,027
8,540
times
15,081
8,739
9,620
8,313
Average Collection Period
days
days
2,546
6,566
46,654
33,643
Inventory Turnover
times
times
17,688
14,012
95,396
120,809
$ 159,738
$ 168,464
Average Days in Inventory
Profit Margin
days
days
%
%
$ 8,634
1,247
26,248
$ 4,295
16,270
16,979
Asset Turnover
times
times
Return on Assets
36,129
37,544
%
%
26,584
36,030
35,889
32,283
Equity Multiplier
98,602
105,857
Return on Equity
%
%
3,795
87,956
97,745
11,715
Common stock (par and additional paid-in capital)
Retained earnings
Accumulated other comprehensive income (loss)
Less: Treasury stock and other equity adjustments
Total shareholders' equity
112,294
(16,491)
(38,462).
61,136
(111,379)
62,607
$ 168,464
Show Image Transcript
Total liabilities and shareholders' equity
$ 159,738
Income Statements
Gross profit
Operating expenses
Net sales
Cost of goods sold
Other (income) expense-net
Income before taxes
$ 84,009
53,700
27,616
10,369
56,393
43,331
34,725
20,331
Here's the best solution from Chegg's library.
(2,600)
3,728
19,068
19,272
Income tax expense
2,299
1,414
Net income
Basic net income per share
$ 16,769
$ 17,858*
$ 5.87
$ 3.07
Any follow-up questions
*This is before income from discontinued operations.
Evaluate and compare the two companies by responding to the following questions.
Expert Solution
This question has been solved!
Explore an expertly crafted, step-by-step solution for a thorough understanding of key concepts.
Step by stepSolved in 2 steps

Knowledge Booster
Similar questions
- hi im looking at the solution above and have a quuestion-im a littlepuzzled on exactly how i should be plugging in the numbersfor example, the chart liists Time (ln2/(ln(1+r)) but how exactly should i type this in my calculatorto get =l3/J3? maybe im overthinking itarrow_forwardmyedio.com Question 12 Listen Use the function f(x)=2x-5 • Find the inverse of f(x). . . Graph f(x) and f(x) and state the domain of each function. Prove that f(x) and f¹(x) are inverses, both graphically and algebraically. ATTACHMENTS W Algebra2 U9 UnitTest_Q17 docx 146.32 KBarrow_forwardReq1-Req2 were incorrect. Can you try the problem again ?arrow_forward
arrow_back_ios
arrow_forward_ios
Recommended textbooks for you

 AccountingAccountingISBN:9781337272094Author:WARREN, Carl S., Reeve, James M., Duchac, Jonathan E.Publisher:Cengage Learning,
 Accounting Information SystemsAccountingISBN:9781337619202Author:Hall, James A.Publisher:Cengage Learning,
 Horngren's Cost Accounting: A Managerial Emphasis...AccountingISBN:9780134475585Author:Srikant M. Datar, Madhav V. RajanPublisher:PEARSON
 Intermediate AccountingAccountingISBN:9781259722660Author:J. David Spiceland, Mark W. Nelson, Wayne M ThomasPublisher:McGraw-Hill Education
 Financial and Managerial AccountingAccountingISBN:9781259726705Author:John J Wild, Ken W. Shaw, Barbara Chiappetta Fundamental Accounting PrinciplesPublisher:McGraw-Hill Education


Accounting
Accounting
ISBN:9781337272094
Author:WARREN, Carl S., Reeve, James M., Duchac, Jonathan E.
Publisher:Cengage Learning,

Accounting Information Systems
Accounting
ISBN:9781337619202
Author:Hall, James A.
Publisher:Cengage Learning,

Horngren's Cost Accounting: A Managerial Emphasis...
Accounting
ISBN:9780134475585
Author:Srikant M. Datar, Madhav V. Rajan
Publisher:PEARSON

Intermediate Accounting
Accounting
ISBN:9781259722660
Author:J. David Spiceland, Mark W. Nelson, Wayne M Thomas
Publisher:McGraw-Hill Education

Financial and Managerial Accounting
Accounting
ISBN:9781259726705
Author:John J Wild, Ken W. Shaw, Barbara Chiappetta Fundamental Accounting Principles
Publisher:McGraw-Hill Education