MATLAB: An Introduction with Applications
6th Edition
ISBN: 9781119256830
Author: Amos Gilat
Publisher: John Wiley & Sons Inc
expand_more
expand_more
format_list_bulleted
Concept explainers
Topic Video
Question

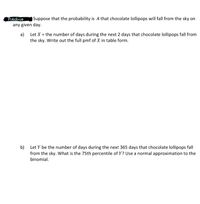
Transcribed Image Text:PrActice
any given day.
Suppose that the probability is .4 that chocolate lollipops will fall from the sky on
a)
Let X = the number of days during the next 2 days that chocolate lollipops fall from
the sky. Write out the full pmf of X in table form.
b) Let Y be the number of days during the next 365 days that chocolate lollipops fall
from the sky. What is the 75th percentile of Y? Use a normal approximation to the
binomial.
Expert Solution
This question has been solved!
Explore an expertly crafted, step-by-step solution for a thorough understanding of key concepts.
Step by stepSolved in 6 steps

Knowledge Booster
Learn more about
Need a deep-dive on the concept behind this application? Look no further. Learn more about this topic, statistics and related others by exploring similar questions and additional content below.Similar questions
- The histogram has a longer tail/appears roughly the same/has a longer right tail so the distribution of the data is not skewed/skewed to the left/ skewed to the rightarrow_forwardCrossing Ontario Between 1954 and 2003, swimmershave crossed Lake Ontario 43 times. Both women andmen have made the crossing. Here are some plots (we’veomitted a crossing by Vikki Keith, who swam a roundtrip—North to South to North—in 3390 minutes): How much difference is there between the mean amount of time (in minutes) it would take female and male swim-mers to swim the lake? a) Construct and interpret a 95% confidence interval forthe difference between female and male times.b) Comment on the assumptions and conditions.arrow_forwardP-Value meansarrow_forward
- a population has mean score of 50 if five points are added to each score what is the new meanarrow_forwardPlease help with D E F Please Help with D E Farrow_forwardMitchell is getting ready to take a baseball rules exam in order to becomne certified as a baseball umnpire in his local community. Past scores on the rules exam form a normal distribution with u = 80 and o = 6. Mitchell must score in the highest 25% of the distribution in order to become a certified umpire. Which minimum score does Mitchell need to obtain on the rules exam to become a certified umpire? OX= 76 O X- 84 OX= 86 OX-81arrow_forward
- The average American gets a haircut every 34 days. Is the average smaller for college students? The data below shows the results of a survey of 15 college students asking them how many days elapse between haircuts. Assume that the distribution of the population is normal. 35, 23, 32, 38, 31, 39, 35, 25, 30, 36, 40, 27, 23, 32, 25 What can be concluded at the the a = 0.10 level of significance level of significance? a. For this study, we should use Select an answer b. The null and alternative hypotheses would be: Ho: ?v Select an answerv Hi: ?vSelect an answerv c. The test statistic ?v = (please show your answer to 3 decimal places.) d. The p-value = (Please show your answer to 3 decimal places.) e. The p-value is 2v a f. Based on this, we should Select an answerv the null hypothesis. g. Thus, the final conclusion is that.. O The data suggest the population mean is not significantly lower than 34 at a = 0.10, so there M 24 3. 4. 5 6. 7 EUarrow_forwardSuppose a researcher wants to test if the average diastolic blood pressure in African-Americans is different than the average diastolic blood pressure in the general population. Note that the average diastolic blood pressure in the general population is 70 mmHG. The researcher retains the null hypothesis, so she therefore concludes... Group of answer choices The mean diastolic blood pressure in African-Americans is equal to that of the general population The mean diastolic blood pressure in African-Americans is different than that of the general populationarrow_forwardAn outlierarrow_forward
arrow_back_ios
SEE MORE QUESTIONS
arrow_forward_ios
Recommended textbooks for you
 MATLAB: An Introduction with ApplicationsStatisticsISBN:9781119256830Author:Amos GilatPublisher:John Wiley & Sons Inc
 Probability and Statistics for Engineering and th...StatisticsISBN:9781305251809Author:Jay L. DevorePublisher:Cengage Learning
 Statistics for The Behavioral Sciences (MindTap C...StatisticsISBN:9781305504912Author:Frederick J Gravetter, Larry B. WallnauPublisher:Cengage Learning
 Elementary Statistics: Picturing the World (7th E...StatisticsISBN:9780134683416Author:Ron Larson, Betsy FarberPublisher:PEARSON
 The Basic Practice of StatisticsStatisticsISBN:9781319042578Author:David S. Moore, William I. Notz, Michael A. FlignerPublisher:W. H. Freeman
 Introduction to the Practice of StatisticsStatisticsISBN:9781319013387Author:David S. Moore, George P. McCabe, Bruce A. CraigPublisher:W. H. Freeman

MATLAB: An Introduction with Applications
Statistics
ISBN:9781119256830
Author:Amos Gilat
Publisher:John Wiley & Sons Inc

Probability and Statistics for Engineering and th...
Statistics
ISBN:9781305251809
Author:Jay L. Devore
Publisher:Cengage Learning

Statistics for The Behavioral Sciences (MindTap C...
Statistics
ISBN:9781305504912
Author:Frederick J Gravetter, Larry B. Wallnau
Publisher:Cengage Learning

Elementary Statistics: Picturing the World (7th E...
Statistics
ISBN:9780134683416
Author:Ron Larson, Betsy Farber
Publisher:PEARSON

The Basic Practice of Statistics
Statistics
ISBN:9781319042578
Author:David S. Moore, William I. Notz, Michael A. Fligner
Publisher:W. H. Freeman

Introduction to the Practice of Statistics
Statistics
ISBN:9781319013387
Author:David S. Moore, George P. McCabe, Bruce A. Craig
Publisher:W. H. Freeman