
MATLAB: An Introduction with Applications
6th Edition
ISBN: 9781119256830
Author: Amos Gilat
Publisher: John Wiley & Sons Inc
expand_more
expand_more
format_list_bulleted
Related questions
Question

Transcribed Image Text:pothesis
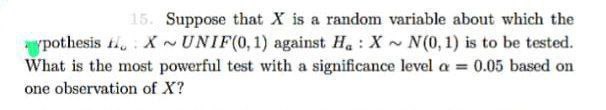
15. Suppose that X is a random variable about which the
XUNIF(0, 1) against Ha: X~N(0, 1) is to be tested.
What is the most powerful test with a significance level a = 0.05 based on
one observation of X?
Expert Solution
This question has been solved!
Explore an expertly crafted, step-by-step solution for a thorough understanding of key concepts.

Step by stepSolved in 2 steps with 6 images

Knowledge Booster

Similar questions
- Q4) Suppose that when data from an experiment was analyzed, the P-value for testing Ho: u = 100 versus Ha: µ < 100 was calculated as 0.047. At the 0.01 significance level, Họ wouldarrow_forwardSuppose that x is a normally distributed random variable with mean 5and standard distribution is 6. Find z value corresponding to x=17.arrow_forwardin a simple randon sample size of 89, there were 40 individuals in the category of interest. It is desired to test -- Ho: P=0.46 vs H1: P<46. Compute the statistic Zarrow_forward
- X is a random variable with mean 30 and standard deviation 4. Y is a random variable with mean 50 and standard deviation 8. Find the mean of random variable Z for each of the following cases. Please show your work. 1) Z=12X-5 2) Z= X-Y 3) Z= -2X+2Yarrow_forwardSuppose you needed to test the claim that the two samples described below come from populations with the same mean. Assume that the samples are independent simple random samples. Sample 1: n1 13, a1 = 24, 81 = 7.55 Sample 2: n2 = 3, x2 = 21.9, 82 = 8.92 Find: (a) The estimated degree of freedom is (b) The standardized test statistic is (use Sample 1 - Sample 2)arrow_forwardwhich of these comparison between an ANOVA and t test is correct? A. a t test provides more flexibilty in research studies than an ANOVA B. An ANOVA examines wheater mean differences exists between conditions wheres t test does not C. An ANOVA can be used to compare three or more conditions wheres a t test cannot D. A t test can be used to compare two conditions wheres an ANOVA cannot.arrow_forward
- An urn contains 7 black and 18 white balls. A ball is randomly drawn from the urn. Let X = 1 if a white ball is drawn and let X = -1 if a black ball is drawn. Find the following a) mean of X b) variance of X Please provide your working and round your answers to 2 decimal placesarrow_forwardSuppose that average rainfall in your city is normally distributed, and for the past 36 months, the rainfall has been 0.5 inches per day on average with a standard deviation of 0.16. Let x be a random variable that has a normal distribution and represents the rainfall in inches per day. Using a 0.05 level of significance, you want to test the hypothesis that monthly rainfall has been 0.7 inches per day on average. What conclusion do you make from your test? Select one: a. Reject H0; the average rainfall is not 0.5 inches. b. Reject H0; the average rainfall is not 0.7 inches. c. Do not reject H0; the average rainfall is still 0.5 inches. d. Do not reject H0; the average rainfall is still 0.7 inches.arrow_forwardA study of parental empathy for sensitivity cues and baby temperament (higher scores mean more empathy) was performed. Let x, be a random variable that represents the score of a mother on an empathy test (as regards her baby). Let x, be the empathy = 68.36. Another random sample of 31 fathers gave score of a father. A random sample of 37 mothers gave a sample mean of x, X, = 60.06. Assume that o, = 11.55 and o, = 11.45. (a) Let u, be the population mean of x, and let u, be the population mean of x,. Find a 99% confidence interval for u, - Hz. (Round your answers to two decimal places.) lower limit upper limit (b) Examine the confidence interval and explain what it means in the context of this problem. Does the confidence interval contain all positive, all negative, or both positive and negative numbers? What does this tell you about the relationship between average empathy scores for mothers compared with those for fathers at the 99% confidence level? Because the interval contains only…arrow_forward
- A transect is an archaeological study area that is 1/5 mile wide and 1 mile long. A site in a transect is the location of a significant archaeological find. Let x represent the number of sites per transect. In a section of Chaco Canyon, a large number of transects showed that x has a population variance ?2 = 42.3. In a different section of Chaco Canyon, a random sample of 19 transects gave a sample variance s2 = 46.9 for the number of sites per transect. Use a 5% level of significance to test the claim that the variance in the new section is greater than 42.3. Find a 95% confidence interval for the population variance. (b) Find the value of the chi-square statistic for the sample. (Round your answer to two decimal places.)- 19.96 What are the degrees of freedom? -18 (c) Find or estimate the P-value of the sample test statistic. P-value > 0.1000.050 < P-value < 0.100 0.025 < P-value < 0.0500.010 < P-value < 0.0250.005 < P-value < 0.010P-value < 0.005…arrow_forwardA transect is an archaeological study area that is 1/5 mile wide and 1 mile long. A site in a transect is the location of a significant archaeological find. Let x represent the number of sites per transect. In a section of Chaco Canyon, a large number of transects showed that x has a population variance ?2 = 42.3. In a different section of Chaco Canyon, a random sample of 21 transects gave a sample variance s2 = 49.3 for the number of sites per transect. Use a 5% level of significance to test the claim that the variance in the new section is greater than 42.3................arrow_forward
arrow_back_ios
arrow_forward_ios
Recommended textbooks for you
- MATLAB: An Introduction with ApplicationsStatisticsISBN:9781119256830Author:Amos GilatPublisher:John Wiley & Sons Inc
 Probability and Statistics for Engineering and th...StatisticsISBN:9781305251809Author:Jay L. DevorePublisher:Cengage Learning
 Statistics for The Behavioral Sciences (MindTap C...StatisticsISBN:9781305504912Author:Frederick J Gravetter, Larry B. WallnauPublisher:Cengage Learning
  Elementary Statistics: Picturing the World (7th E...StatisticsISBN:9780134683416Author:Ron Larson, Betsy FarberPublisher:PEARSON
 The Basic Practice of StatisticsStatisticsISBN:9781319042578Author:David S. Moore, William I. Notz, Michael A. FlignerPublisher:W. H. Freeman
 Introduction to the Practice of StatisticsStatisticsISBN:9781319013387Author:David S. Moore, George P. McCabe, Bruce A. CraigPublisher:W. H. Freeman
MATLAB: An Introduction with Applications
Statistics
ISBN:9781119256830
Author:Amos Gilat
Publisher:John Wiley & Sons Inc
Probability and Statistics for Engineering and th...
Statistics
ISBN:9781305251809
Author:Jay L. Devore
Publisher:Cengage Learning
Statistics for The Behavioral Sciences (MindTap C...
Statistics
ISBN:9781305504912
Author:Frederick J Gravetter, Larry B. Wallnau
Publisher:Cengage Learning
Elementary Statistics: Picturing the World (7th E...
Statistics
ISBN:9780134683416
Author:Ron Larson, Betsy Farber
Publisher:PEARSON
The Basic Practice of Statistics
Statistics
ISBN:9781319042578
Author:David S. Moore, William I. Notz, Michael A. Fligner
Publisher:W. H. Freeman
Introduction to the Practice of Statistics
Statistics
ISBN:9781319013387
Author:David S. Moore, George P. McCabe, Bruce A. Craig
Publisher:W. H. Freeman