
Calculus: Early Transcendentals
8th Edition
ISBN: 9781285741550
Author: James Stewart
Publisher: Cengage Learning
expand_more
expand_more
format_list_bulleted
Related questions
Question

Transcribed Image Text:### Question 11
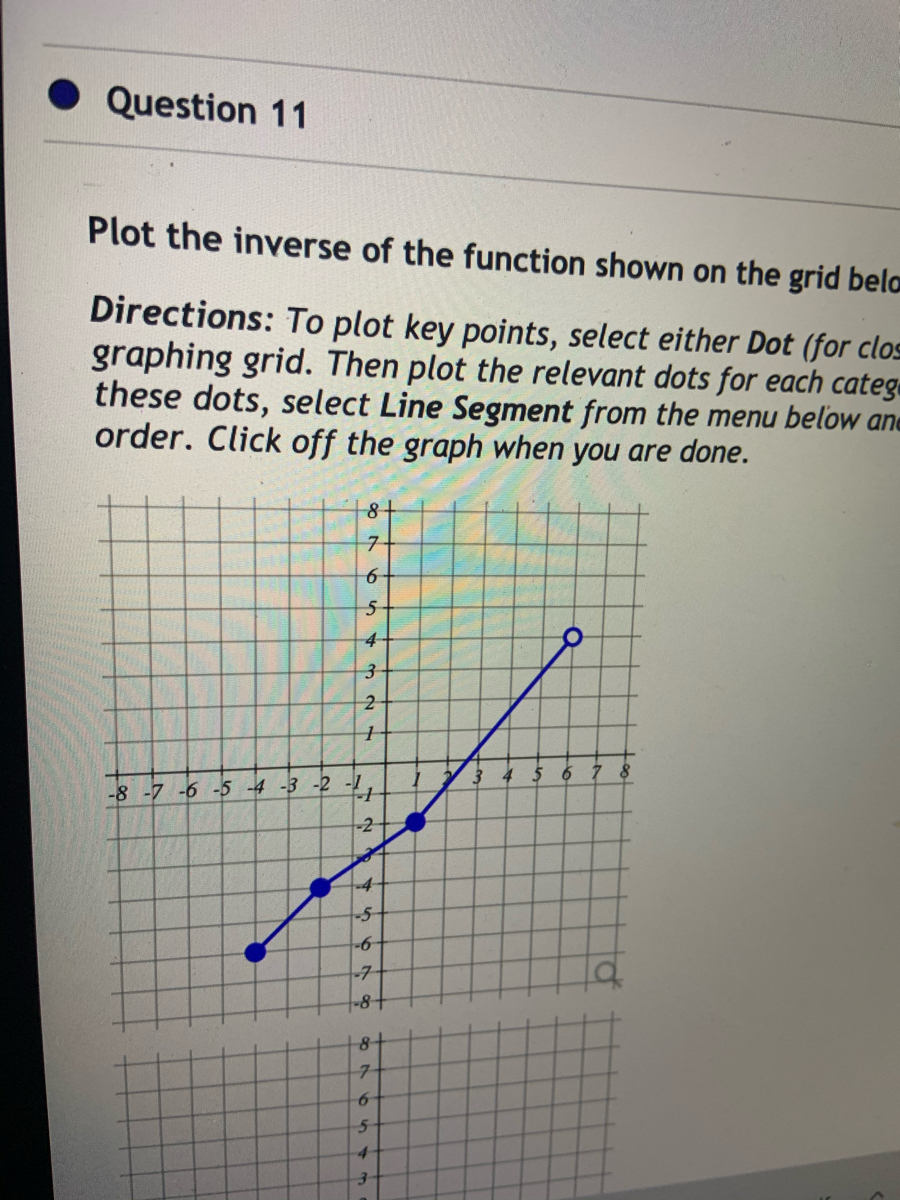
**Plot the inverse of the function shown on the grid below.**
#### Directions:
To plot key points, select either **Dot** (for close approximation) or **Circle** from the toolbar below the graphing grid. Then plot the relevant dots for each category. To connect these dots, select **Line Segment** from the menu below and draw in sequential order. Click off the graph when you are done.
#### Graph Description:
The graph displayed consists of a coordinate plane with a plotted function represented by a blue line connecting several key points. The x-axis ranges from -8 to 8, and the y-axis ranges from -8 to 8.
##### Plotted Points:
The key points where the function intersects are:
- (-6, -7)
- (-4, -5)
- (-2, -3)
- (1, 3)
The blue line segments connect these points in a straight sequence, indicating a linear or piecewise-linear function.
#### Instructions Recap:
1. **Select Dot or Circle** from the toolbar.
2. Plot the given key points.
3. Choose **Line Segment** to connect the key points in order.
4. Click off the graph when the plot is complete.
Expert Solution
This question has been solved!
Explore an expertly crafted, step-by-step solution for a thorough understanding of key concepts.

This is a popular solution

Trending nowThis is a popular solution!

Step by stepSolved in 2 steps with 2 images

Knowledge Booster


Learn more about
Need a deep-dive on the concept behind this application? Look no further. Learn more about this topic, calculus and related others by exploring similar questions and additional content below.Similar questions
- Use the horizontal line test to explain why a non constant linear function has an inverse function, whereas a quadratic function does not.arrow_forward2. Determine the inverse of each function, then state its domain and range.arrow_forwardDescribe how to find the inverse of a one-to-one function ?arrow_forward
Recommended textbooks for you
- Calculus: Early TranscendentalsCalculusISBN:9781285741550Author:James StewartPublisher:Cengage Learning
 Thomas' Calculus (14th Edition)CalculusISBN:9780134438986Author:Joel R. Hass, Christopher E. Heil, Maurice D. WeirPublisher:PEARSON
 Calculus: Early Transcendentals (3rd Edition)CalculusISBN:9780134763644Author:William L. Briggs, Lyle Cochran, Bernard Gillett, Eric SchulzPublisher:PEARSON
  Calculus: Early TranscendentalsCalculusISBN:9781319050740Author:Jon Rogawski, Colin Adams, Robert FranzosaPublisher:W. H. Freeman
 Calculus: Early Transcendental FunctionsCalculusISBN:9781337552516Author:Ron Larson, Bruce H. EdwardsPublisher:Cengage Learning
Calculus: Early Transcendentals
Calculus
ISBN:9781285741550
Author:James Stewart
Publisher:Cengage Learning
Thomas' Calculus (14th Edition)
Calculus
ISBN:9780134438986
Author:Joel R. Hass, Christopher E. Heil, Maurice D. Weir
Publisher:PEARSON
Calculus: Early Transcendentals (3rd Edition)
Calculus
ISBN:9780134763644
Author:William L. Briggs, Lyle Cochran, Bernard Gillett, Eric Schulz
Publisher:PEARSON
Calculus: Early Transcendentals
Calculus
ISBN:9781319050740
Author:Jon Rogawski, Colin Adams, Robert Franzosa
Publisher:W. H. Freeman
Calculus: Early Transcendental Functions
Calculus
ISBN:9781337552516
Author:Ron Larson, Bruce H. Edwards
Publisher:Cengage Learning