Introduction to Chemical Engineering Thermodynamics
8th Edition
ISBN: 9781259696527
Author: J.M. Smith Termodinamica en ingenieria quimica, Hendrick C Van Ness, Michael Abbott, Mark Swihart
Publisher: McGraw-Hill Education
expand_more
expand_more
format_list_bulleted
Question
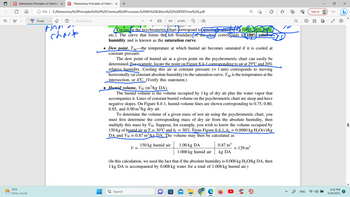
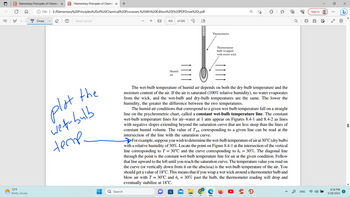
Plot the dew point temperature, humid volume, and wet-bulb temperature for each one.

Transcribed Image Text:||!
PD Elementary Principles of Chemica X PDF *Elementary Principles of Chemic X +
✪ File
72°F
Partly cloudy
Draw
E:/Elementary%20Principles%20of%20Chemical%20Processes,%204th%20Edition%20(%20PDFDrive%20).pdf
(T) Read aloud
Fina
chart
J
Curves on the psychrometric/chart correspond to specified values of (106%, 90%.)80%)
etc.). The curve that forms the left boundary(of the chart corresponds to (100% relative
humidity and is known as the saturation curve.
452 of 695
• Dew point, Tap the temperature at which humid air becomes saturated if it is cooled at
constant pressure.
rm20/₂OVT
The dew point of humid air at a given point on the psychrometric chart can easily be
determined. For example, locate the point on Figure 8.4-1 corresponding to air at 29°℃ and 20%
relative humidity. Cooling this air at constant pressure (= 1 atm) corresponds to moving
horizontally (at constant absolute humidity) to the saturation curve. Tap is the temperature at the
intersection, or 4°C. (Verify this statement.)
● Humid volume, Ví (m³/kg DA).
The humid volume is the volume occupied by 1 kg of dry air plus the water vapor that
accompanies it. Lines of constant humid volume on the psychrometric chart are steep and have
negative slopes. On Figure 8.4-1, humid-volume lines are shown corresponding to 0.75, 0.80,
0.85, and 0.90 m³/kg dry air.
To determine the volume of a given mass of wet air using the psychrometric chart, you
must first determine the corresponding mass of dry air from the absolute humidity, then
multiply this mass by Vн. Suppose, for example, you wish to know the volume occupied by
150 kg of humid air at T = 30°C and h₁ = 30%. From Figure 8.4-1, ha = 0.0080 kg H₂O(v)/kg
DA and VH≈ 0.87 m³/kg DA. The volume may then be calculated as
V =
Q Search
150 kg humid air
1.00 kg DA
1.008 kg humid air
0.87 m³
= 129 m³
kg DA
(In this calculation, we used the fact that if the absolute humidity is 0.008 kg H₂O/kg DA, then
1 kg DA is accompanied by 0.008 kg water for a total of 1.008 kg humid air.)
{"
10
@
33
ENG
Sign in
00
:
9:32 PM
5/28/2023

Transcribed Image Text:||!
PD Elementary Principles of Chemica X PDF *Elementary Principles of Chemic X +
✪ File
72°F
Partly cloudy
Draw
E:/Elementary%20Principles%20of%20Chemical%20Processes,%204th%20Edition%20(%20PDFDrive%20).pdf
T Read aloud
plot the
wet-bulb
teme.
Q Search
455
of 695
Humid
air
(D
Thermometer
Thermometer
bulb wrapped
with moist wick
The wet-bulb temperature of humid air depends on both the dry-bulb temperature and the
moisture content of the air. If the air is saturated (100% relative humidity), no water evaporates
from the wick, and the wet-bulb and dry-bulb temperatures are the same. The lower the
humidity, the greater the difference between the two temperatures.
The humid air conditions that correspond to a given wet-bulb temperature fall on a straight
line on the psychrometric chart, called a constant wet-bulb temperature line. The constant
wet-bulb temperature lines for air-water at 1 atm appear on Figures 8.4-1 and 8.4-2 as lines
with negative slopes extending beyond the saturation curve that are less steep than the lines of
constant humid volume. The value of Twb corresponding to a given line can be read at the
intersection of the line with the saturation curve.
→→→For example, suppose you wish to determine the wet-bulb temperature of air at 30°C (dry bulb)
with a relative humidity of 30%. Locate the point on Figure 8.4-1 at the intersection of the vertical
line corresponding to T = 30°℃ and the curve corresponding to hr = 30%. The diagonal line
through the point is the constant wet-bulb temperature line for air at the given condition. Follow
that line upward to the left until you reach the saturation curve. The temperature value you read on
the curve (or vertically down from it on the abscissa) is the wet-bulb temperature of the air. You
should get a value of 18°C. This means that if you wrap a wet wick around a thermometer bulb and
blow air with T = 30°C and hr = 30% past the bulb, the thermometer reading will drop and
eventually stabilize at 18°C.
Ⓡ
33
ENG
Sign in
00
:
9:34 PM
5/28/2023
Expert Solution
This question has been solved!
Explore an expertly crafted, step-by-step solution for a thorough understanding of key concepts.
Step by stepSolved in 5 steps with 3 images

Knowledge Booster
Similar questions
arrow_back_ios
arrow_forward_ios
Recommended textbooks for you
 Introduction to Chemical Engineering Thermodynami...Chemical EngineeringISBN:9781259696527Author:J.M. Smith Termodinamica en ingenieria quimica, Hendrick C Van Ness, Michael Abbott, Mark SwihartPublisher:McGraw-Hill Education
 Elementary Principles of Chemical Processes, Bind...Chemical EngineeringISBN:9781118431221Author:Richard M. Felder, Ronald W. Rousseau, Lisa G. BullardPublisher:WILEY
 Elements of Chemical Reaction Engineering (5th Ed...Chemical EngineeringISBN:9780133887518Author:H. Scott FoglerPublisher:Prentice Hall
 Industrial Plastics: Theory and ApplicationsChemical EngineeringISBN:9781285061238Author:Lokensgard, ErikPublisher:Delmar Cengage Learning
 Unit Operations of Chemical EngineeringChemical EngineeringISBN:9780072848236Author:Warren McCabe, Julian C. Smith, Peter HarriottPublisher:McGraw-Hill Companies, The

Introduction to Chemical Engineering Thermodynami...
Chemical Engineering
ISBN:9781259696527
Author:J.M. Smith Termodinamica en ingenieria quimica, Hendrick C Van Ness, Michael Abbott, Mark Swihart
Publisher:McGraw-Hill Education

Elementary Principles of Chemical Processes, Bind...
Chemical Engineering
ISBN:9781118431221
Author:Richard M. Felder, Ronald W. Rousseau, Lisa G. Bullard
Publisher:WILEY

Elements of Chemical Reaction Engineering (5th Ed...
Chemical Engineering
ISBN:9780133887518
Author:H. Scott Fogler
Publisher:Prentice Hall


Industrial Plastics: Theory and Applications
Chemical Engineering
ISBN:9781285061238
Author:Lokensgard, Erik
Publisher:Delmar Cengage Learning

Unit Operations of Chemical Engineering
Chemical Engineering
ISBN:9780072848236
Author:Warren McCabe, Julian C. Smith, Peter Harriott
Publisher:McGraw-Hill Companies, The