
MATLAB: An Introduction with Applications
6th Edition
ISBN: 9781119256830
Author: Amos Gilat
Publisher: John Wiley & Sons Inc
expand_more
expand_more
format_list_bulleted
Related questions
Question
please show work to understand :)
A box contains the following tickets: -2, -1, 0, 1, 3. We draw from the box 100 times with
replacement.
(a) The sum of the positive numbers will be around ________, with a standard error of
________. (Hint: First you will need to make a new box.)
(b) Is it appropriate to use the normal approximation for the sum of the positive numbers?
Why or why not?
(c) What is the approximate chance the sum of the positive numbers is greater than 100?
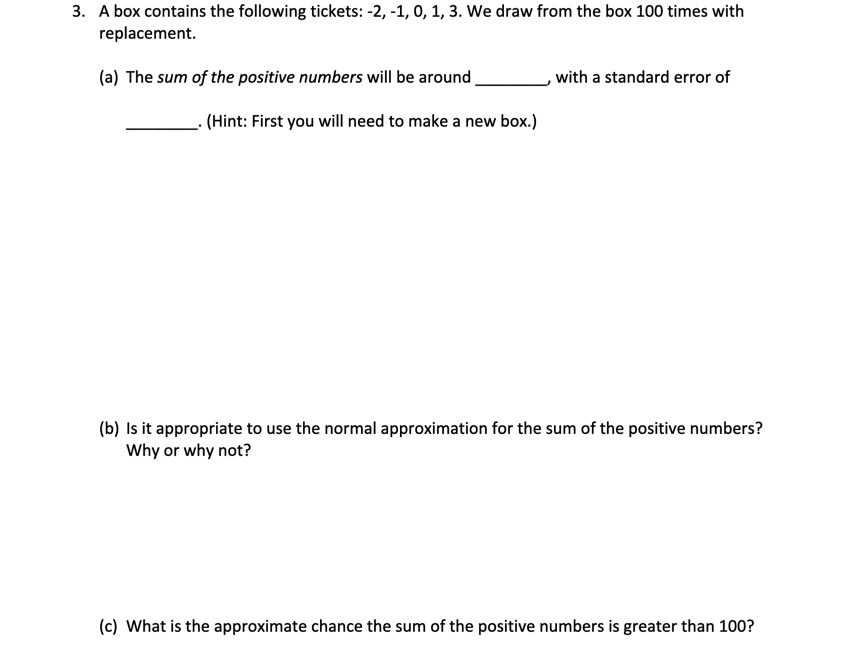

Transcribed Image Text:3. A box contains the following tickets: -2, -1, 0, 1, 3. We draw from the box 100 times with
replacement.
(a) The sum of the positive numbers will be around,
with a standard error of
- (Hint: First you will need to make a new box.)
(b) Is it appropriate to use the normal approximation for the sum of the positive numbers?
Why or why not?
(c) What is the approximate chance the sum of the positive numbers is greater than 100?
Expert Solution
This question has been solved!
Explore an expertly crafted, step-by-step solution for a thorough understanding of key concepts.

This is a popular solution

Trending nowThis is a popular solution!

Step by stepSolved in 2 steps

Knowledge Booster

Similar questions
- ok Assignment: Chap X https://ezto.mheducation.com/ext/map/index.html?_con=con&external_browser=0&laun nework: Chapter 8 (Sections 8.1 and 8. 1 ok It Question 8 - 7-2 Homework: Cha X + nces (a) (b) (c) (d) Calculate the standard error. May normality be assumed? (Round your n = 20, π = 0.21 n = 48, π = 0.27 n = 117, π = 0.53 n = 593, π = 0.002 Standard Error 0.0030 Saved < Prev ************L Normality No 8 of 10 Marrow_forwardBelow is my script for some problems I am doing in RStudio. How do I code to get the statistical data that shows how the male tv hours differ to the female tv hours? Chapter 2 R Lab.R X StudentSurvey.(1) x Source on SaveE T # 3- Ine Exercise nours are skewea Tert 8 xtabs (~Year, Student Survey. (1)) 9 # 1- The highest concentration of students are Sophomores 10 table(Year)/length (Year) II # 2- The relative frequency for seniors was 0.1% (rounded) 11 Student Survey. (1) STV 12 12 TV 13 14 23 15 16 29 18 19 20 21 22 23 21 24:1 hist (TV) →→Run boxplot (TV) # 6- Based on the box plot there is not a smallest outlier, but there are large outliers # The outliers for hours spent watching TV are any values above 20 hours Survey - Student Survey. (1) #Renaming xtabs (~Sex, Survey) install.packages ("lattice") library("lattice") bwplot (TV Sex, Survey) # 7- Men on average watch more TV # 8- Men have more variability in hours watching TV (Top Level) + Source R Script =arrow_forward- (856) De'arra & Ken 4 Life - Yo x Take Test: Assignment 3 - Cha x C Listed Below Are The Top 10 A X o Range Rule of Thumb Calculat x AMean, Median, A mcphs.blackboard.com/webapps/assessment/take/launch.jsp?course assessment_jd=_43603 1&course_id3_34586 18anew_attempt-1&content jo Apps O Course Materials f... 24 Google Calendar -.. Z Men's Nike Air For... > Ximble Money Transfer .. a Amazon.com: Onli. M Inbox (2,847) - iak.. * Question Completion Status: QUESTION 7 Questions 7-8 Statistics are sometimes used to compare or identify authors of different works. The lengths of the first 10 words in a book by Terry are listed with the first 10 words in a book by David. Find the mean and median for each of the two samples (use one more decimal than the original data), then compare the two sets of results. 3 1 10 Terry David: 2. 1 1 3 The mean number of letters per word in Terry's book is The median number of letters per word in Terry's book is The mean number of letters per word in David's…arrow_forward
- Which of the following can be inferred from the figure above? Error Bars are Standard Errors. (Quality of content ratings, based on a sample of college students, is on the y-axis) Hulu and Disney+ don't have a significantly different quality of content Netflix has significantly higher quality content than Hulu HBO Max has higher quality content than all other services We cannot infer any of the above from the information given.arrow_forwardneed answer and all the workarrow_forwardPlease clearly shows the steps. I'm not sure if my answer(1/3) is correct, so please just ignore it and calculate by yourself.arrow_forward
arrow_back_ios
arrow_forward_ios
Recommended textbooks for you
- MATLAB: An Introduction with ApplicationsStatisticsISBN:9781119256830Author:Amos GilatPublisher:John Wiley & Sons Inc
 Probability and Statistics for Engineering and th...StatisticsISBN:9781305251809Author:Jay L. DevorePublisher:Cengage Learning
 Statistics for The Behavioral Sciences (MindTap C...StatisticsISBN:9781305504912Author:Frederick J Gravetter, Larry B. WallnauPublisher:Cengage Learning
  Elementary Statistics: Picturing the World (7th E...StatisticsISBN:9780134683416Author:Ron Larson, Betsy FarberPublisher:PEARSON
 The Basic Practice of StatisticsStatisticsISBN:9781319042578Author:David S. Moore, William I. Notz, Michael A. FlignerPublisher:W. H. Freeman
 Introduction to the Practice of StatisticsStatisticsISBN:9781319013387Author:David S. Moore, George P. McCabe, Bruce A. CraigPublisher:W. H. Freeman
MATLAB: An Introduction with Applications
Statistics
ISBN:9781119256830
Author:Amos Gilat
Publisher:John Wiley & Sons Inc
Probability and Statistics for Engineering and th...
Statistics
ISBN:9781305251809
Author:Jay L. Devore
Publisher:Cengage Learning
Statistics for The Behavioral Sciences (MindTap C...
Statistics
ISBN:9781305504912
Author:Frederick J Gravetter, Larry B. Wallnau
Publisher:Cengage Learning
Elementary Statistics: Picturing the World (7th E...
Statistics
ISBN:9780134683416
Author:Ron Larson, Betsy Farber
Publisher:PEARSON
The Basic Practice of Statistics
Statistics
ISBN:9781319042578
Author:David S. Moore, William I. Notz, Michael A. Fligner
Publisher:W. H. Freeman
Introduction to the Practice of Statistics
Statistics
ISBN:9781319013387
Author:David S. Moore, George P. McCabe, Bruce A. Craig
Publisher:W. H. Freeman