
MATLAB: An Introduction with Applications
6th Edition
ISBN: 9781119256830
Author: Amos Gilat
Publisher: John Wiley & Sons Inc
expand_more
expand_more
format_list_bulleted
Related questions
Question
help please answer in text form with proper workings and explanation for each and every part and steps with concept and introduction no AI no copy paste remember answer must be in proper format with all working
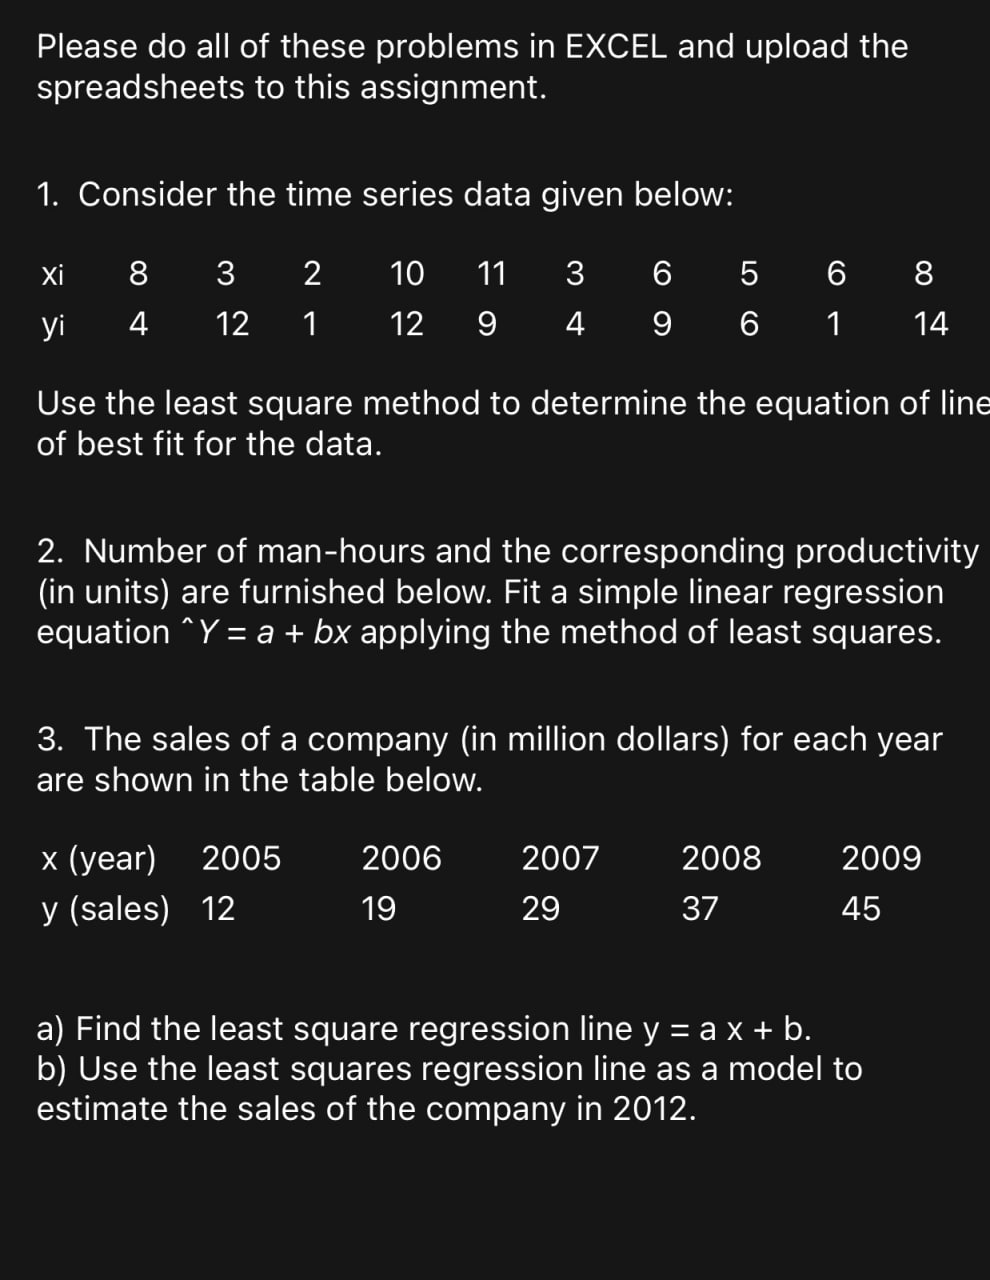

Transcribed Image Text:Please do all of these problems in EXCEL and upload the
spreadsheets to this assignment.
1. Consider the time series data given below:
Xi
8
3
2
10 11 3
6
5
6
8
yi
4
12 1
14
12 9 4 9 6 1
Use the least square method to determine the equation of line
of best fit for the data.
2. Number of man-hours and the corresponding productivity
(in units) are furnished below. Fit a simple linear regression
equation ^Y = a + bx applying the method of least squares.
3. The sales of a company (in million dollars) for each year
are shown in the table below.
x (year)
2005
2006
2007
2008
2009
y (sales) 12
19
29
37
45
a) Find the least square regression line y = ax + b.
b) Use the least squares regression line as a model to
estimate the sales of the company in 2012.
Expert Solution
This question has been solved!
Explore an expertly crafted, step-by-step solution for a thorough understanding of key concepts.

Step by stepSolved in 2 steps

Knowledge Booster

Similar questions
- Provide complete solutionarrow_forwardPlease read the question and leave notes on the answer where appropriate. Please DO NOT skip any steps. Please double check your answer. DO NOT SUBMIT A TYPED RESPONSE. Please use a hand written response that is LEGABLE. Please review your answer to make sure all steps are clearly visible. Please double check your work. Thank you. Show all your work and please make sure to Justify your answers. I am having trouble finding this answer. Please double check your steps and do not submit a typed response that is not in LATEX. Can you please explain how to write this as a linear combination of the other two?arrow_forwardOption a is different from the answer writtenarrow_forward
- Please show examples and final answersarrow_forwardPlease read the question and leave notes on the answer where appropriate. Please DO NOT skip any steps. Please double check your answer. DO NOT SUBMIT A TYPED RESPONSE. Please use a hand written response that is LEGABLE. Please review your answer to make sure all steps are clearly visible. Please double check your work. Thank you. Show all your work and please make sure to Justify your answers. I am having trouble finding this answer. Please double check your steps and do not submit a typed response that is not in LATEX.arrow_forwardPlease answer both questions and be detailed, thank you in advance!arrow_forward
- Please read the question and leave notes on the answer where appropriate. Please DO NOT skip any steps. Please double check your answer. DO NOT SUBMIT A TYPED RESPONSE. Please use a hand written response that is LEGABLE. Please review your answer to make sure all steps are clearly visible. Please double check your work. Thank you. Show all your work and please make sure to Justify your answers. I am having trouble finding this answer. Please double check your steps and do not submit a typed response that is not in LATEX. PLEASE USE A MATRIX TO SOLVE THIS PROBLEM....arrow_forwardNeed a simplified version.arrow_forward
arrow_back_ios
arrow_forward_ios
Recommended textbooks for you
- MATLAB: An Introduction with ApplicationsStatisticsISBN:9781119256830Author:Amos GilatPublisher:John Wiley & Sons Inc
 Probability and Statistics for Engineering and th...StatisticsISBN:9781305251809Author:Jay L. DevorePublisher:Cengage Learning
 Statistics for The Behavioral Sciences (MindTap C...StatisticsISBN:9781305504912Author:Frederick J Gravetter, Larry B. WallnauPublisher:Cengage Learning
  Elementary Statistics: Picturing the World (7th E...StatisticsISBN:9780134683416Author:Ron Larson, Betsy FarberPublisher:PEARSON
 The Basic Practice of StatisticsStatisticsISBN:9781319042578Author:David S. Moore, William I. Notz, Michael A. FlignerPublisher:W. H. Freeman
 Introduction to the Practice of StatisticsStatisticsISBN:9781319013387Author:David S. Moore, George P. McCabe, Bruce A. CraigPublisher:W. H. Freeman
MATLAB: An Introduction with Applications
Statistics
ISBN:9781119256830
Author:Amos Gilat
Publisher:John Wiley & Sons Inc
Probability and Statistics for Engineering and th...
Statistics
ISBN:9781305251809
Author:Jay L. Devore
Publisher:Cengage Learning
Statistics for The Behavioral Sciences (MindTap C...
Statistics
ISBN:9781305504912
Author:Frederick J Gravetter, Larry B. Wallnau
Publisher:Cengage Learning
Elementary Statistics: Picturing the World (7th E...
Statistics
ISBN:9780134683416
Author:Ron Larson, Betsy Farber
Publisher:PEARSON
The Basic Practice of Statistics
Statistics
ISBN:9781319042578
Author:David S. Moore, William I. Notz, Michael A. Fligner
Publisher:W. H. Freeman
Introduction to the Practice of Statistics
Statistics
ISBN:9781319013387
Author:David S. Moore, George P. McCabe, Bruce A. Craig
Publisher:W. H. Freeman