
MATLAB: An Introduction with Applications
6th Edition
ISBN: 9781119256830
Author: Amos Gilat
Publisher: John Wiley & Sons Inc
expand_more
expand_more
format_list_bulleted
Related questions
Concept explainers
Question
please answer the questions in both photos, the options for question b is cut off in the image but when you look at the second photo you'll see all the multiple choice options for that question. Thank you so much
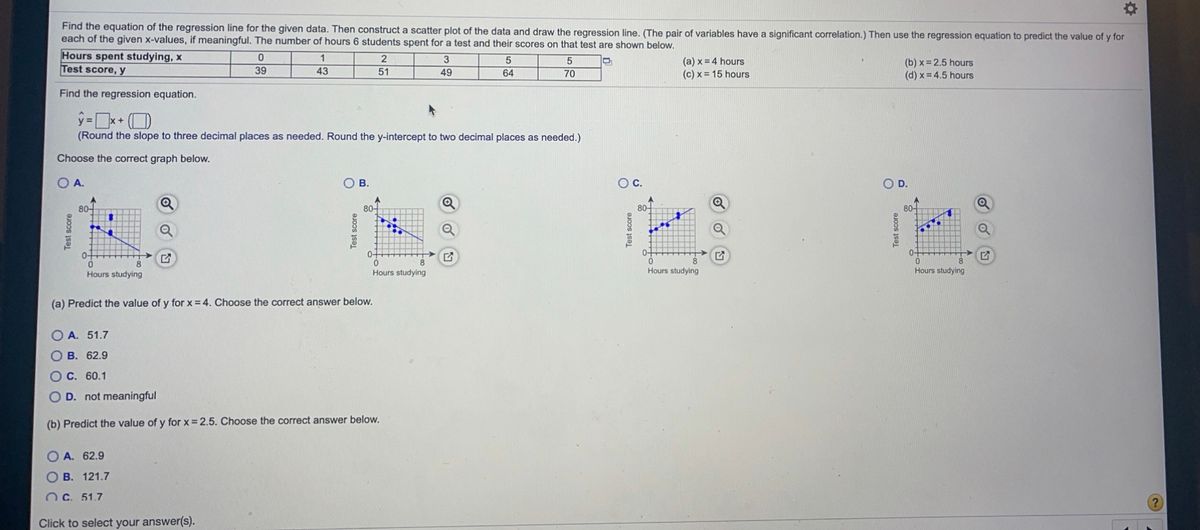

Transcribed Image Text:Find the equation of the regression line for the given data. Then construct a scatter plot of the data and draw the regression line. (The pair of variables have a significant correlation.) Then use the regression equation to predict the value of y for
each of the given x-values, if meaningful. The number of hours 6 students spent for a test and their scores on that test are shown below.
Hours spent studying, x
Test score, y
1
2
3
(a) x = 4 hours
(c) x = 15 hours
(b) x = 2.5 hours
(d) x = 4.5 hours
39
43
51
49
64
70
Find the regression equation.
(Round the slope to three decimal places as needed. Round the y-intercept to two decimal places as needed.)
Choose the correct graph below.
OA.
OB.
Oc.
OD.
80-
80-
80-
80-
0-
0-
Hours studying
Hours studying
Hours studying
Hours studying
(a) Predict the value of y for x = 4. Choose the correct answer below.
O A. 51.7
О В. 62.9
Ос. 60.1
O D. not meaningful
(b) Predict the value of y for x = 2.5. Choose the correct answer below.
O A. 62.9
О В. 121.7
O C. 51.7
Click to select your answer(s).
Test score
Test score
Test score
Test score

Transcribed Image Text:Find the equation of the regression line for the given data. Then construct a scatter plot of the data and draw the regression line. (The pair of variables have a significant correlation.) Then use the regression equation to predict the value of y for
each of the given x-values, if meaningful. The number of hours 6 students spent for a test and their scores on that test are shown below.
Hours spent studying, x
Test score, y
1
(a) x = 4 hours
(c) x = 15 hours
(b) x= 2.5 hours
(d) x = 4.5 hours
39
43
51
49
64
70
U D. OZ.9
O C. 60.1
OD. not meaningful
(b) Predict the value of y for x = 2.5. Choose the correct answer below.
O A. 62.9
О В. 121.7
О с. 51.7
O D. not meaningful
(c) Predict the value of y for x= 15. Choose the correct answer below.
O A. 60.1
O B. 51.7
OC. 121.7
OD. not meaningful
(d) Predict the value of y for x = 4.5. Choose the correct answer below.
O A. 62.9
O B. 121.7
O C. 60.1
OD. not meaningful
Click to select your answer(s).
Expert Solution
This question has been solved!
Explore an expertly crafted, step-by-step solution for a thorough understanding of key concepts.

Step by stepSolved in 2 steps with 1 images

Knowledge Booster


Learn more about
Need a deep-dive on the concept behind this application? Look no further. Learn more about this topic, statistics and related others by exploring similar questions and additional content below.Similar questions
- i am still missing 2 more questionsarrow_forwardPlease check the quality of the answer in the text. Makes no sense. Can you please write the answer and take a pic and upload please. And i also i shouldnt be charged for this follow question as its not a questionarrow_forwardThanks , but I need answer Of 5 question. Thank you.arrow_forward
arrow_back_ios
arrow_forward_ios
Recommended textbooks for you
- MATLAB: An Introduction with ApplicationsStatisticsISBN:9781119256830Author:Amos GilatPublisher:John Wiley & Sons Inc
 Probability and Statistics for Engineering and th...StatisticsISBN:9781305251809Author:Jay L. DevorePublisher:Cengage Learning
 Statistics for The Behavioral Sciences (MindTap C...StatisticsISBN:9781305504912Author:Frederick J Gravetter, Larry B. WallnauPublisher:Cengage Learning
  Elementary Statistics: Picturing the World (7th E...StatisticsISBN:9780134683416Author:Ron Larson, Betsy FarberPublisher:PEARSON
 The Basic Practice of StatisticsStatisticsISBN:9781319042578Author:David S. Moore, William I. Notz, Michael A. FlignerPublisher:W. H. Freeman
 Introduction to the Practice of StatisticsStatisticsISBN:9781319013387Author:David S. Moore, George P. McCabe, Bruce A. CraigPublisher:W. H. Freeman
MATLAB: An Introduction with Applications
Statistics
ISBN:9781119256830
Author:Amos Gilat
Publisher:John Wiley & Sons Inc
Probability and Statistics for Engineering and th...
Statistics
ISBN:9781305251809
Author:Jay L. Devore
Publisher:Cengage Learning
Statistics for The Behavioral Sciences (MindTap C...
Statistics
ISBN:9781305504912
Author:Frederick J Gravetter, Larry B. Wallnau
Publisher:Cengage Learning
Elementary Statistics: Picturing the World (7th E...
Statistics
ISBN:9780134683416
Author:Ron Larson, Betsy Farber
Publisher:PEARSON
The Basic Practice of Statistics
Statistics
ISBN:9781319042578
Author:David S. Moore, William I. Notz, Michael A. Fligner
Publisher:W. H. Freeman
Introduction to the Practice of Statistics
Statistics
ISBN:9781319013387
Author:David S. Moore, George P. McCabe, Bruce A. Craig
Publisher:W. H. Freeman