
MATLAB: An Introduction with Applications
6th Edition
ISBN: 9781119256830
Author: Amos Gilat
Publisher: John Wiley & Sons Inc
expand_more
expand_more
format_list_bulleted
Related questions
Question
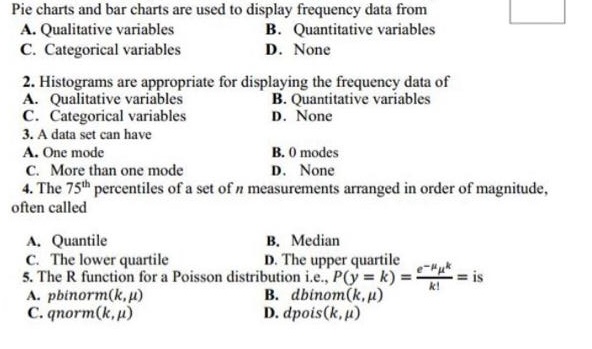

Transcribed Image Text:Pie charts and bar charts are used to display frequency data from
A. Qualitative variables
B. Quantitative variables
D. None
C. Categorical variables
2. Histograms are appropriate for displaying the frequency data of
A. Qualitative variables
B. Quantitative variables
D. None
C. Categorical variables
3. A data set can have
A. One mode
C. More than one mode
4. The 75th percentiles of a set of n measurements arranged in order of magnitude,
often called
B. 0 modes
D. None
A. Quantile
B. Median
C. The lower quartile
D. The upper quartile
5. The R function for a Poisson distribution i.e., P(y = k) = 3 = is
e-μμk
k!
A. pbinorm(k, µ)
C. qnorm(k,u)
B. dbinom(k, u)
D. dpois (k, μ)
Expert Solution
This question has been solved!
Explore an expertly crafted, step-by-step solution for a thorough understanding of key concepts.
Step 1
VIEW Pie charts and bar charts are used to display frequency data from
VIEW 2 Histograms are appropriate for displaying the frequency data of
VIEW A data set can have
VIEW 4 The 75th percentiles of a set of n measurements arranged in order of magnitude, often called
VIEW 5. The R function for a Poisson distribution
VIEW 
Step by stepSolved in 6 steps

Knowledge Booster

Similar questions
- Please, find Arthematic Mean, Geomatric Mean, Harmonic Mean, Mode & Median of the given data. ASAParrow_forward34arrow_forwardFind the 5 number summary for the data shown 13 24 27 28 38 45 46 48 52 78 84 90 5 number summary: Use the Locator/Percentile method described in your book, not your calculator. Add Work Check Answerarrow_forward
- 3. The data in the table shows the mileage that students commute to school. B. Find the weighted mean. Miles Midpoint Frequency 10 - 14 12 8 15 - 19 17 C. Draw a histogram for the data. 20 - 24 22 9 25 - 29 27 21 30 - 34 32 7 A. How many students are in the class?arrow_forward10. Refer back to the histogram from question #4.(Attatched)a. Compute the mean number of shipping daysc. Write the 5-number summary for this data.d. Create box plot.arrow_forwardFind the 5 number summary for the data shown 17 21 29 30 36 42 56 60 88 91 94 97 5 number summary:Use the Locator/Percentile method described in your book, not your calculator.arrow_forward
- What is the best way to graphically present the shape of the distribution of numeric variable? a. histogram b. scatter plot c. line graph d. pie chartarrow_forwardTwenty-five randomly selected students were asked the number of movies they watched the previous week. The results are as follows. # of movies Frequency Relative Frequency Cumulative Relative Frequency 0 5 1 9 2 6 3 4 4 1 Table 2.67 Construct a histogram of the data. Complete the columns of the chart.arrow_forward1. Determine whether the following variable is discrete or continuous: Room temperature (measured in Celsius) 2. A data set has mean=202, median=205 and mode=197. Determine the shape of the data. a. Skewed Left b. Symmetric c. Skewed Right d. Some other shapearrow_forward
- Your assignment is to survey 10 people (friends, family, peers, etc.) and collect data for the following dependent measure:arrow_forwardplease don't provide hand writtin solution...arrow_forwardDetermine which of the four levels of measurement ( norminal, ordinal, interval, ratio) is most appropriate for the data below. Years in which U.S. presidents were inauguratedarrow_forward
arrow_back_ios
SEE MORE QUESTIONS
arrow_forward_ios
Recommended textbooks for you
- MATLAB: An Introduction with ApplicationsStatisticsISBN:9781119256830Author:Amos GilatPublisher:John Wiley & Sons Inc
 Probability and Statistics for Engineering and th...StatisticsISBN:9781305251809Author:Jay L. DevorePublisher:Cengage Learning
 Statistics for The Behavioral Sciences (MindTap C...StatisticsISBN:9781305504912Author:Frederick J Gravetter, Larry B. WallnauPublisher:Cengage Learning
  Elementary Statistics: Picturing the World (7th E...StatisticsISBN:9780134683416Author:Ron Larson, Betsy FarberPublisher:PEARSON
 The Basic Practice of StatisticsStatisticsISBN:9781319042578Author:David S. Moore, William I. Notz, Michael A. FlignerPublisher:W. H. Freeman
 Introduction to the Practice of StatisticsStatisticsISBN:9781319013387Author:David S. Moore, George P. McCabe, Bruce A. CraigPublisher:W. H. Freeman
MATLAB: An Introduction with Applications
Statistics
ISBN:9781119256830
Author:Amos Gilat
Publisher:John Wiley & Sons Inc
Probability and Statistics for Engineering and th...
Statistics
ISBN:9781305251809
Author:Jay L. Devore
Publisher:Cengage Learning
Statistics for The Behavioral Sciences (MindTap C...
Statistics
ISBN:9781305504912
Author:Frederick J Gravetter, Larry B. Wallnau
Publisher:Cengage Learning
Elementary Statistics: Picturing the World (7th E...
Statistics
ISBN:9780134683416
Author:Ron Larson, Betsy Farber
Publisher:PEARSON
The Basic Practice of Statistics
Statistics
ISBN:9781319042578
Author:David S. Moore, William I. Notz, Michael A. Fligner
Publisher:W. H. Freeman
Introduction to the Practice of Statistics
Statistics
ISBN:9781319013387
Author:David S. Moore, George P. McCabe, Bruce A. Craig
Publisher:W. H. Freeman