
MATLAB: An Introduction with Applications
6th Edition
ISBN: 9781119256830
Author: Amos Gilat
Publisher: John Wiley & Sons Inc
expand_more
expand_more
format_list_bulleted
Related questions
Topic Video
Question
I have a statistics question. Question number 23 which circled on attached image.

Transcribed Image Text:phoW ot aoitel
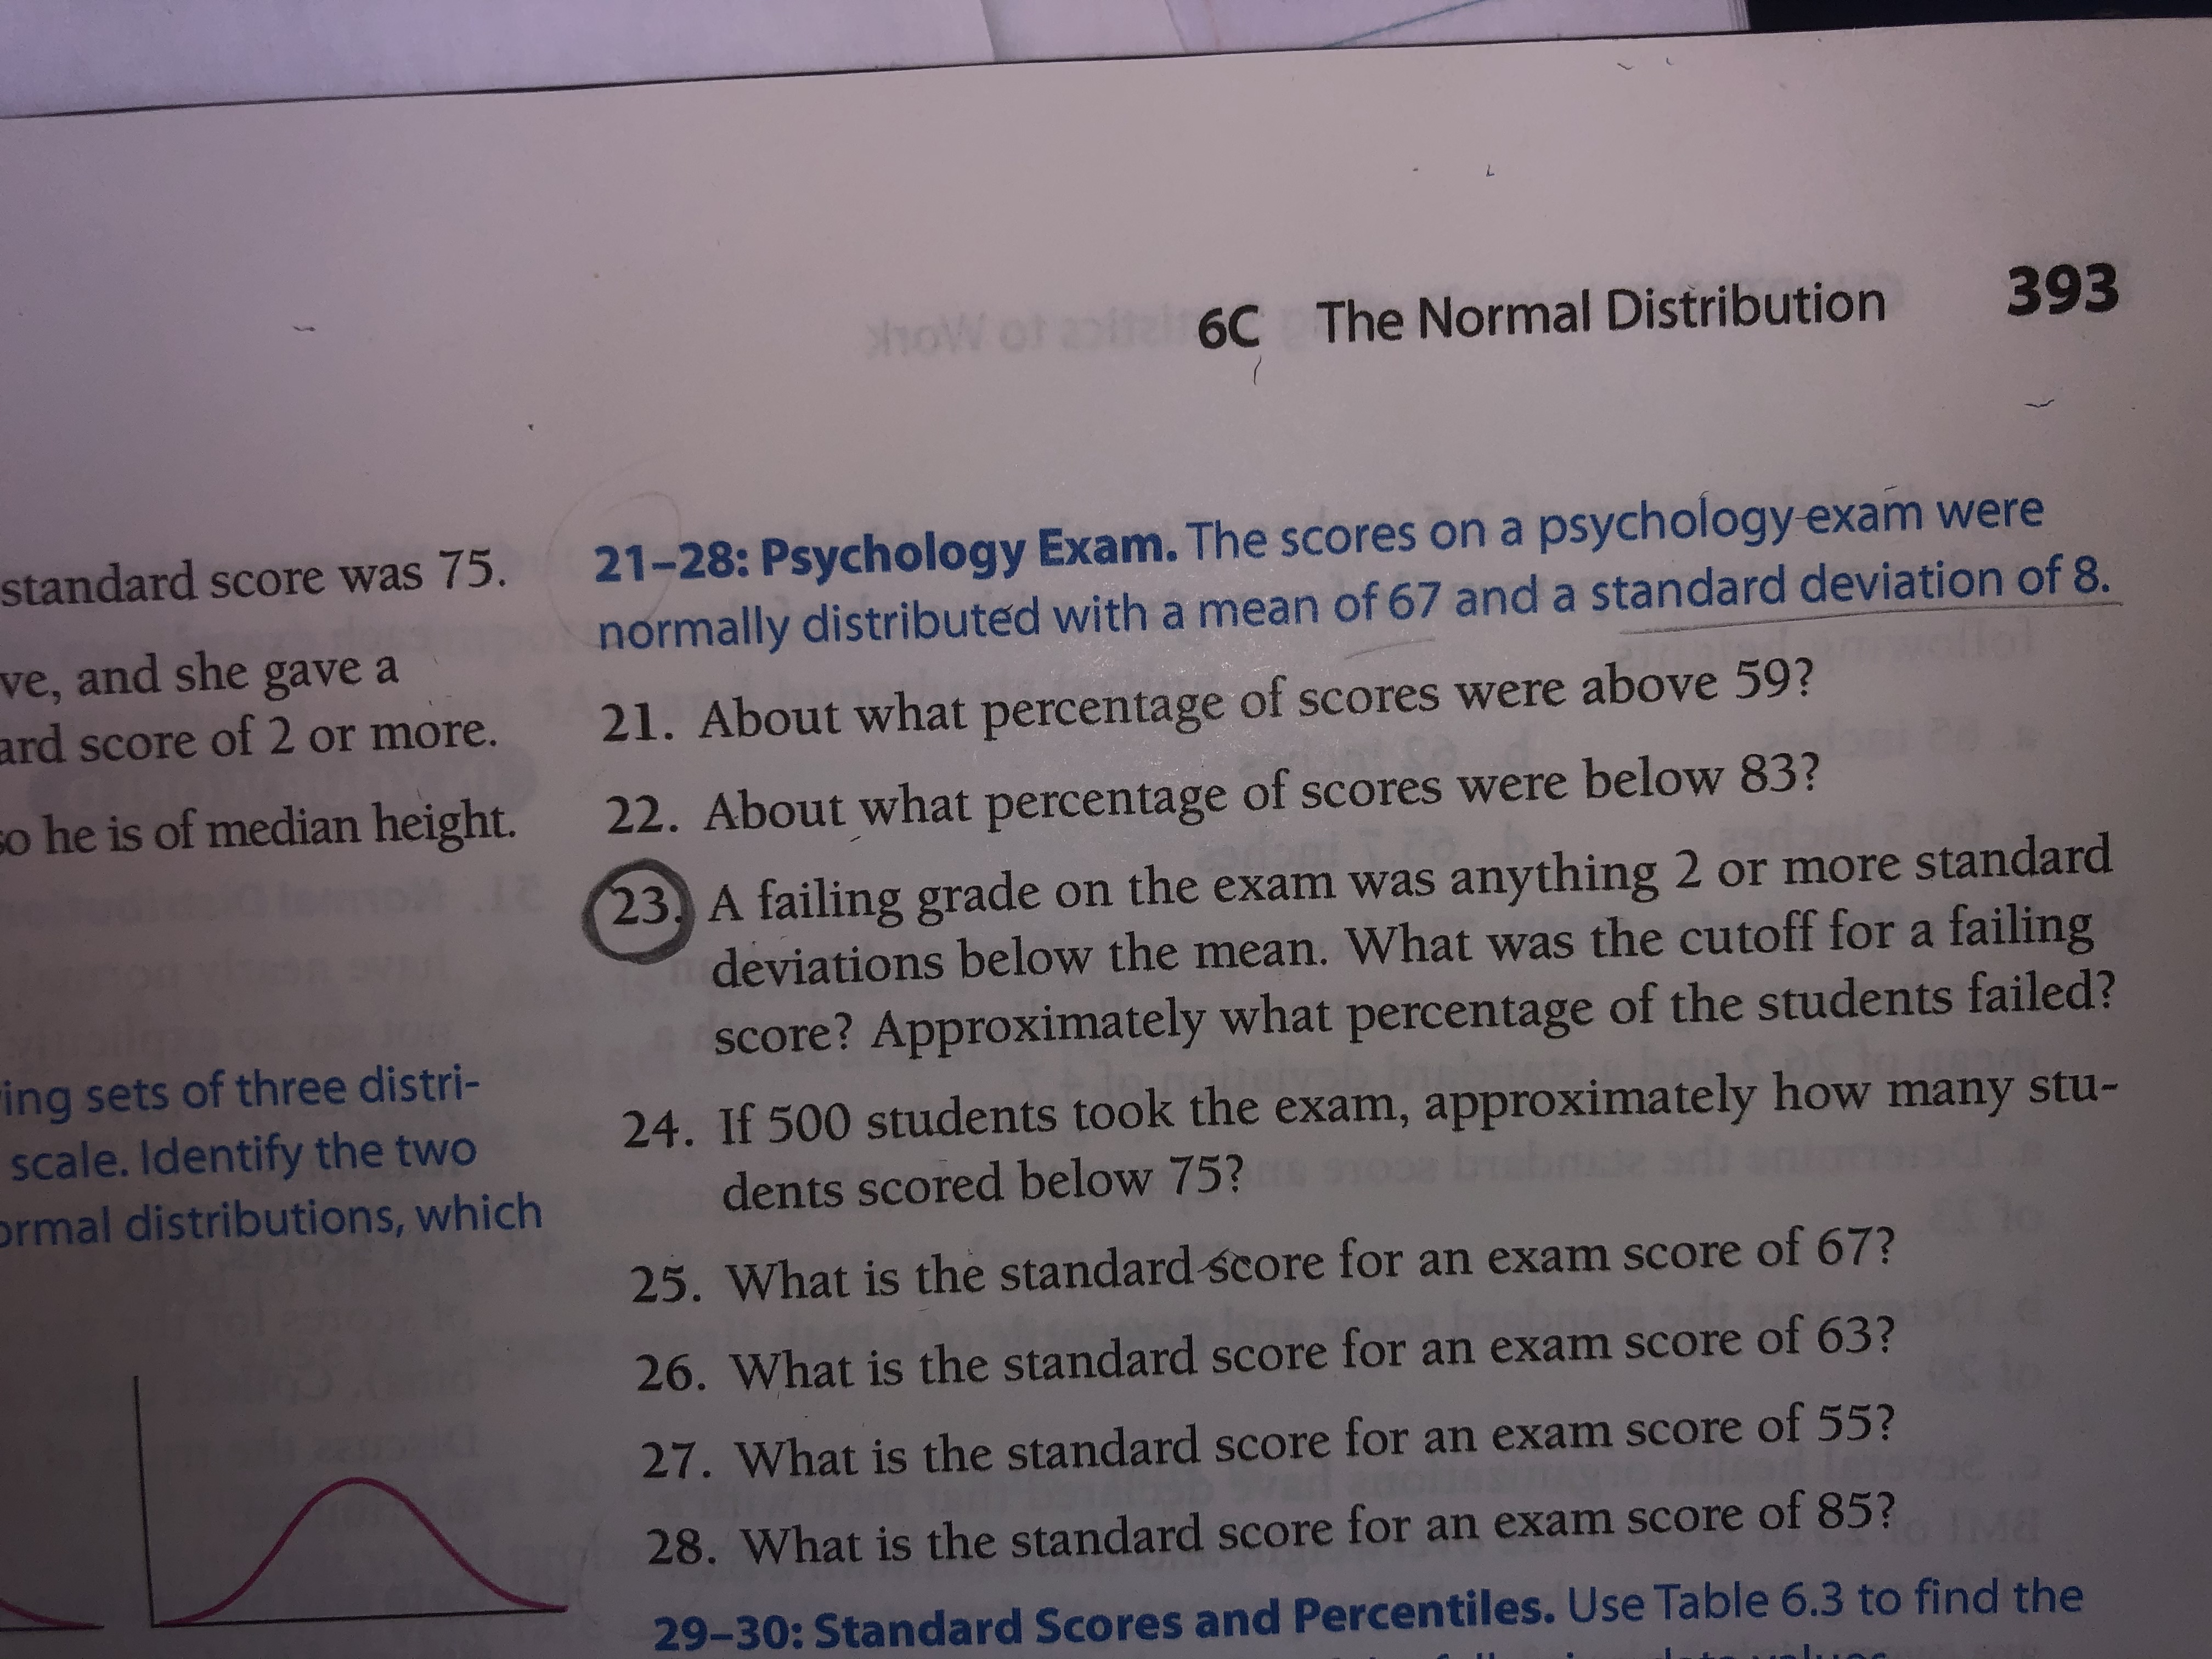
6C The Normal Distribution 393
standard score was 75. 21-28: Psychology Exam. The scores on a psychology exam were
normally distributed with a mean of 67 and a standard deviation of 8.
ve, and she gave a
ard score of 2 or more.
21. About what percentage of scores were above 59?
co he is of median height.
22. About what percentage of scores were below 83?
23, A failing grade on the exam was anything 2 or more standard
deviations below the mean. What was the cutoff for a failing
score? Approximately what percentage of the students failed?
ing sets of three distri-
scale. Identify the two
ormal distributions, which
24. If 500 students took the exam, approximately how many stu-
dents scored below 75?
91008 bsbr esd
25. What is the standard score for an exam score of 67?
26. What is the standard score for an exam score of 63?
27. What is the standard score for an exam score of 55?
28. What is the standard score for an exam score of 85?
IM8
29-30: Standard Scores and Percentiles. Use Table 6.3 to find the
Expert Solution
This question has been solved!
Explore an expertly crafted, step-by-step solution for a thorough understanding of key concepts.

This is a popular solution

Trending nowThis is a popular solution!

Step by stepSolved in 3 steps with 3 images

Knowledge Booster


Learn more about
Need a deep-dive on the concept behind this application? Look no further. Learn more about this topic, statistics and related others by exploring similar questions and additional content below.Similar questions
- The mean of 14 numbers in a data set is 43. A new number is included in the data set. It changes the mean to 44. What is the new number? Record the result below accurate to two decimal places.arrow_forwardThe total blood cholesterol level was measured for each of 21 adults. Here are the 21 measurements (in mg/dL). 131, 139, 152, 161, 163, 165, 176, 181, 185, 185, 185, 189, 193, 194, 195, 206, 210, 213, 214, 233, 249 Send data to calculator Send data to Excel Frequency 10+ 6. 8. 6- 4 4 4. 2- 0--/- 200 225 250 150 Cholesterol level (in mg/dL) 125 175 2. 寸 2.arrow_forwardA group of 500 students take a survey about distance learning. 150 prefer distance learning. What is the proportion of students that prefer distance learning.arrow_forward
- In a recent article you see a histogram graph that displayed the average number of hours teens get in a night. The graph is a form of what type of statistics? Descriptive or Inferentialarrow_forwardIf a coin is flipped 225 times and the number of Hs is 75. Compute the proportion of Hs. Round to three places.arrow_forwardhttps://mediaplayer.pearsoncmg.com/assets/APS10_sl_1202?clip=8 Video it links.arrow_forward
- Determine whether the data are qualitative or quantitative.2) The colors of automobiles on a used car lotarrow_forwardThere are five numbers in a data set. They are 3, 1, 16, 20 and x, where x is one of the largest two number of the five. What value does x need to be so that the median of the five numbers equals the mean of the five numbers?arrow_forward
arrow_back_ios
arrow_forward_ios
Recommended textbooks for you
- MATLAB: An Introduction with ApplicationsStatisticsISBN:9781119256830Author:Amos GilatPublisher:John Wiley & Sons Inc
 Probability and Statistics for Engineering and th...StatisticsISBN:9781305251809Author:Jay L. DevorePublisher:Cengage Learning
 Statistics for The Behavioral Sciences (MindTap C...StatisticsISBN:9781305504912Author:Frederick J Gravetter, Larry B. WallnauPublisher:Cengage Learning
  Elementary Statistics: Picturing the World (7th E...StatisticsISBN:9780134683416Author:Ron Larson, Betsy FarberPublisher:PEARSON
 The Basic Practice of StatisticsStatisticsISBN:9781319042578Author:David S. Moore, William I. Notz, Michael A. FlignerPublisher:W. H. Freeman
 Introduction to the Practice of StatisticsStatisticsISBN:9781319013387Author:David S. Moore, George P. McCabe, Bruce A. CraigPublisher:W. H. Freeman
MATLAB: An Introduction with Applications
Statistics
ISBN:9781119256830
Author:Amos Gilat
Publisher:John Wiley & Sons Inc
Probability and Statistics for Engineering and th...
Statistics
ISBN:9781305251809
Author:Jay L. Devore
Publisher:Cengage Learning
Statistics for The Behavioral Sciences (MindTap C...
Statistics
ISBN:9781305504912
Author:Frederick J Gravetter, Larry B. Wallnau
Publisher:Cengage Learning
Elementary Statistics: Picturing the World (7th E...
Statistics
ISBN:9780134683416
Author:Ron Larson, Betsy Farber
Publisher:PEARSON
The Basic Practice of Statistics
Statistics
ISBN:9781319042578
Author:David S. Moore, William I. Notz, Michael A. Fligner
Publisher:W. H. Freeman
Introduction to the Practice of Statistics
Statistics
ISBN:9781319013387
Author:David S. Moore, George P. McCabe, Bruce A. Craig
Publisher:W. H. Freeman