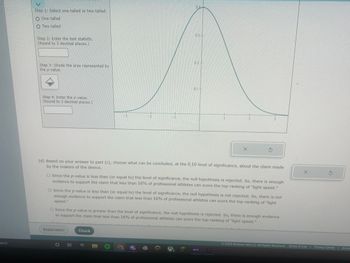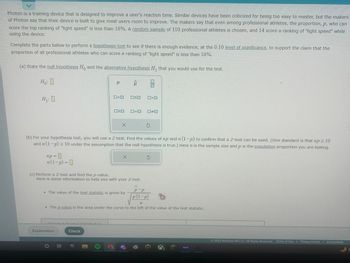
Photon is a training device that is designed to improve a user's reaction time. Similar devices have been criticized for being too easy to master, but the makers of Photon say that their device is built to give most users room to improve. The makers say that even among professional athletes, the proportion, , who can score the top ranking of "light speed" is less than 16%. A random sample of 110 professional athletes is chosen, and 14 score a ranking of "light speed" while using the device.
Complete the parts below to perform a hypothesis test to see if there is enough evidence, at the level of significance, to support the claim that the proportion of all professional athletes who can score a ranking of "light speed" is less than 16% .


Trending nowThis is a popular solution!
Step by stepSolved in 5 steps with 3 images

- An important issue is whether there are racial differences in hypertension among children. We define hypertension as being above the 95th percentile for either systolic blood pressure (SBP) or diastolic blood pressure (DBP) among children of the same age, height, and sex. Since some of the children were observed at multiple visits, a GEE model was run of hypertension on ethnic group. There were three ethnic groups considered: Caucasian, African American, and Hispanic. The results among boys are given in Table 13.54. TABLE 13.54 Relationship between hypertension and ethnic group among 27,009 boys in the Pediatric Task Force Data Variable Regression Coefficient SE Intercept -2.07 0.026 African American 0.049 0.041 Hispanic 0.328 0.059 What is the estimated OR for hypertension comparing Hispanic boys vs. Caucasian boys? (Call this OR1.) What is a 95% CI for this estimate?arrow_forwardResearchers conducted a study to determine the effects of different types of alcohol on the peak alcohol concentration. In one part of the study, the researchers gave 15 randomly select males a controlled volume of vodka and monitored the subjects' alcohol concentration following the period of consumption. The legal limit for driving is 80 mg/dL (milligrams per deciliter of blood). A hypothesis test was conducted to see if the mean peak alcohol concentration from drinking vodka was different from the legal driving limit. This was reflected in the null and alternative hypotheses ?0:??1:?=80 mg/dL≠80 mg/dL The researchers required their results to be statistically significant at a level of ?=0.10. The mean peak alcohol concentration of the participants after drinking a controlled volume of vodka was 77.4 mg/dL with a standard deviation of 17.25 mg/dL. Determine the confidence interval that corresponds to the ?‑test. Give the lower and upper bounds precise to two decimal placesarrow_forwardDatabase A contains 40 data items and is made up with an equal number of the values of 0 and 100 and has a mean of 50. Database B also has 40 entries made up equally of the values 49 and51 and also has a mean of 50. Which database will have the smaller value for its standard deviation?arrow_forward
- A recent study revealed that the average weight of babies born in the United States is normally distributed with a mean of 7.5 pounds. This number is lower than recent years and so researchers are interested in determining what factors are associated with lower birth weights. One researcher decides to look at the age of the mother to determine if younger mothers have babies that are significantly heavier or lighter than average. To study this the researcher collects data from 87 babies who were born to mothers between the ages of 16 and 18. Only one baby was measured per mother. Twins and other multiple births were excluded. The average weight for these babies was 7.3 pounds with a standard deviation of .6 pounds Select the two-tailed null hypothesis for this statistical analysis. The babies of young mothers will not be significantly different than the weight of babies in the general population. The babies of young mothers will be significantly lighter than the…arrow_forwardThe drug manufacturer claim that taking gemfibrozil is beneficial to reduce the chance of heart attacks. 2051 men took the medication, and a control group of 2030 men took a placebo. During the next five years, 56 men in the drug group and 84 men in the placebo group had heart attacks. We would like to compare the proportion of men who develop heart attacks between the drug group and the placebo group. What are the correct x1 and x2 values in order to calculate the pooled sample proportion? a) x1=2051, x2=2030 b) x1=2051, x2=84 c) x1=56, x2=2030 O d) x1=56, x2=84arrow_forwardA researcher studying stress is interested in the blood pressure measurements of chief executive officers (CEOS) of major corporations. He has good reason to believe that the mean systolic blood pressure, u, of CEOS of major corporations is less than 130 mm Hg, which is the value reported in a possibly outdated journal article. He plans to perform a statistical test. He measures the systolic blood pressures of a random sample of CEOS of major corporations and finds the mean of the sample to be 120 mm Hg and the standard deviation of the sample to be 15 mm Hg. Based on this information, complete the parts below. (a) What are the null hypothesis H, and the alternative hypothesis H, that should be used for the test? H :0 Oarrow_forwardA researcher studying stress is interested in the blood pressure measurements of chief executive officers (CEOs) of major corporations. He has good reason to believe that the mean systolic blood pressure, μ, of CEOs of major corporations is different from 132 mm Hg, which is the value reported in a possibly outdated journal article. He plans to perform a statistical test. He measures the systolic blood pressures of a random sample of CEOs of major corporations and finds the mean of the sample to be 124 mm Hg and the standard deviation of the sample to be 20 mm Hg. Based on this information, complete the parts below. A. H0: H1: B. Suppose that the researcher decides to reject the null hypothesis. Would the research be making a type I or type II error?arrow_forwardA certain training device measures reaction times of users by illuminating lights, one at a time, and measuring the time it takes the user to press each light to turn it off. The makers of the device are marketing it for high-level training, saying that even among professional athletes, the proportion who can score the top ranking of "light speed" is less than 22% . As a fitness trainer who wants to buy the device to attract more customers, you want to feel comfortable that the claim made by the makers is correct. To test the claim, you decide to perform a hypothesis test. To do so, you rent the device and have a random sample of 130 professional athletes use it; 26 score a ranking of "light speed." You confirm that it is appropriate to perform a Z -test. Why is a Z -test appropriate? Find z , the value of the test statistic for your Z -test. Round your answer to three or more decimal places. =zarrow_forwardA dietician read in a survey that 70.5% of adults in the U.S. do not eat breakfast at least 3 days a week. She believes that the proportion that skip breakfast 3 days a week is different than 0.705. To verify her claim, she selects a random sample of 71 adults and asks them how many days a week they skip breakfast.. 44 of them report that they skip breakfast at least 3 days a week. Test her claim at a = 0.10. The correct hypotheses would be: О Но:р 0.705 (claim) Но: р > 0.705 HA:p < 0.705 (claim) О Но: р — 0.705 HA:P + 0.705 (claim) Since the level of significance is 0.10 the critical value is 1.645 and -1.645 The test statistic is: (round to 3 places) The p-value is: (round to 3 places) The decision can be made to: O reject Ho O do not reject Ho The final conclusion is that: O There is enough evidence to reject the claim that the proportion that skip breakfast 3 days a week is different than 0.705. O There is not enough evidence to reject the claim that the proportion that skip…arrow_forwardA researcher gathered a sample of participants who volunteered for a studying of phobias. She measured anxiety level of participants as they viewed photos of spiders and again when they viewed puppies. Which statistical test is appropriate for this study and why?arrow_forwardDr. Watts is a pediatrician. His group did some research on the sleep habits of children less than 24 months old. They found a weak negative correlation between a child’s age and the number of hours per day he or she slept. What does this mean? As a child’s age increases, the hours of sleep decreases in a nearly perfect pattern. As a child’s age increases, the hours of sleep increases in a nearly perfect pattern. As a child’s age increases, the hours of sleep decreases but the relationship is not perfect. As a child’s age increases, the hours of sleep increases but the relationship is not perfect.arrow_forwardMany small restaurants in Portland, Oregon, and other cities across the United States do not take reservations. Owners say that with smaller capacity, no-shows are costly, and they would rather have their staff focused on customer service rather than maintaining a reservation system. However, it is important to be able to give reasonable estimates of waiting time when customers arrive and put their name on the waiting list. The file RestaurantLine contains 10 observations of number of people in line ahead of a customer (independent variable x) and actual waiting time (dependent variable y). The estimated regression equation is: ŷ=4.35+8.81x and MSE=94.4236. Point Estimate for customers who arrive with 3 people on the wait list is 30.8 minutes. a. Develop a 95% confidence interval for the mean waiting time for a customer who arrives with three customers already in line (to 2 decimals). b. Develop a 95% prediction interval for Roger and Sherry Davy's waiting time if there are three…arrow_forwardarrow_back_iosSEE MORE QUESTIONSarrow_forward_ios
 MATLAB: An Introduction with ApplicationsStatisticsISBN:9781119256830Author:Amos GilatPublisher:John Wiley & Sons Inc
 Probability and Statistics for Engineering and th...StatisticsISBN:9781305251809Author:Jay L. DevorePublisher:Cengage Learning
 Statistics for The Behavioral Sciences (MindTap C...StatisticsISBN:9781305504912Author:Frederick J Gravetter, Larry B. WallnauPublisher:Cengage Learning
 Elementary Statistics: Picturing the World (7th E...StatisticsISBN:9780134683416Author:Ron Larson, Betsy FarberPublisher:PEARSON
 The Basic Practice of StatisticsStatisticsISBN:9781319042578Author:David S. Moore, William I. Notz, Michael A. FlignerPublisher:W. H. Freeman
 Introduction to the Practice of StatisticsStatisticsISBN:9781319013387Author:David S. Moore, George P. McCabe, Bruce A. CraigPublisher:W. H. Freeman


