
MATLAB: An Introduction with Applications
6th Edition
ISBN: 9781119256830
Author: Amos Gilat
Publisher: John Wiley & Sons Inc
expand_more
expand_more
format_list_bulleted
Related questions
Question

Transcribed Image Text:.
1
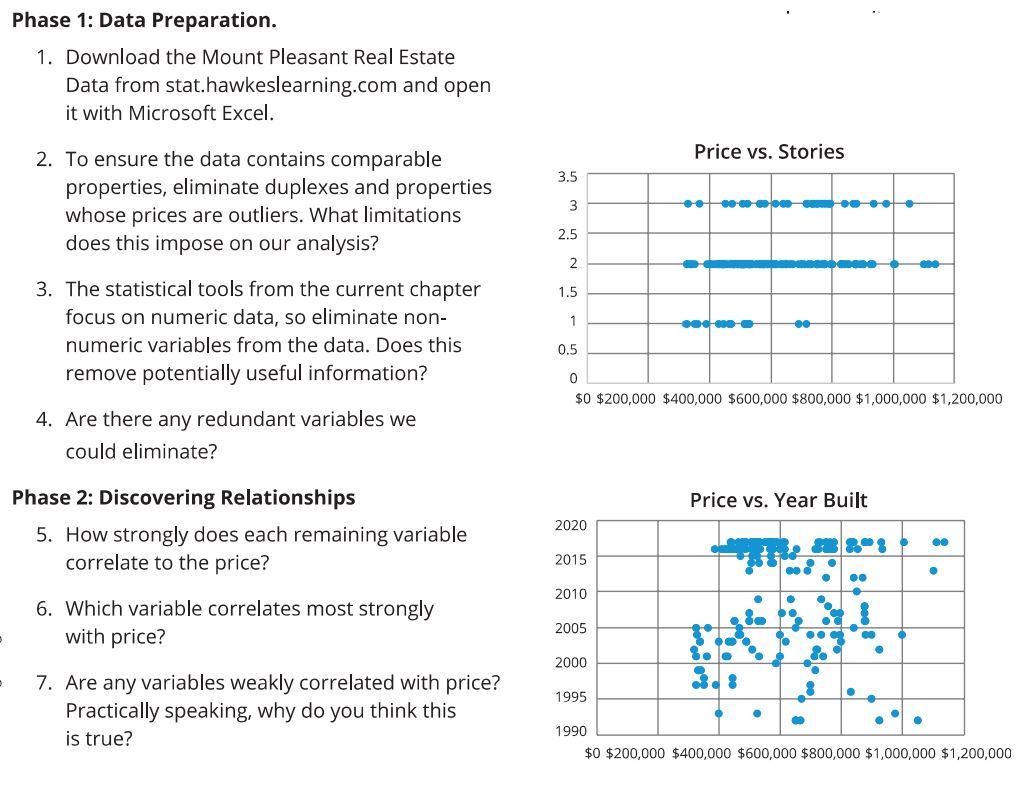
Phase 1: Data Preparation.
1. Download the Mount Pleasant Real Estate
Data from stat.hawkeslearning.com and open
it with Microsoft Excel.
2. To ensure the data contains comparable
properties, eliminate duplexes and properties
whose prices are outliers. What limitations
does this impose on our analysis?
3. The statistical tools from the current chapter
focus on numeric data, so eliminate non-
numeric variables from the data. Does this
remove potentially useful information?
4. Are there any redundant variables we
could eliminate?
Phase 2: Discovering Relationships
5. How strongly does each remaining variable
correlate to the price?
6. Which variable correlates most strongly
with price?
7. Are any variables weakly correlated with price?
Practically speaking, why do you think this
is true?
3.5
3
2.5
2
1.5
1
2020
2015
2010
2005
2000
1995
Price vs. Stories
0.5
0
$0 $200,000 $400,000 $600,000 $800,000 $1,000,000 $1,200,000
1990
●●
-
*0% no m
●●
Homme
●
Price vs. Year Built
881
●●
•
*
●
**
●
$0 $200,000 $400,000 $600,000 $800,000 $1,000,000 $1,200,000

Transcribed Image Text:Phase 3: Constructing Predictive Models.
8. Find the regression line ŷ = b + b₁x predicting
home price by the variable most highly
correlated to it.
What proportion of the variablity in
home prices is explained by this
variable in a straigt line model?
Find the five number summary for
this variable. Predict the price of
homes at each value of this five
number summary using your
regression line.
List Price
$1,200,000
$1,000,000
$800,000
$600,000
$400,000
$200,000
0
0
Square Footage Line Fit Plot
◆ List Price
■ Predicted
List Price
1000 2000 3000 4000 5000 6000
9. Find the 95% confidence interval for B₁, the slope of the population linear regression model. Also,
conduct a hypothesis test for the significance of B₁, that is test, Ho: P₁ = 0 vs. Ha: P₁ = 0 and state the
conclusion. Does this result and the confidence interval agree? If so, why?
Expert Solution
This question has been solved!
Explore an expertly crafted, step-by-step solution for a thorough understanding of key concepts.

This is a popular solution
Step 1: Write the given information.
VIEW Step 2: Eliminate the non numerical data from the Mount Pleasant Real Estate data.
VIEW Step 3: Run the correlation analysis for the given data set.
VIEW Step 4: Run the regression analysis between price and square footage.
VIEW Step 5: Determine the five number summary of the variable square footage and predicted values.
VIEW Step 6: Determine the 95% confidence interval for slope and conduct the hypothesis for the same.
VIEW Step 7: Conduct the hypothesis test for the slope coefficient.
VIEW Solution
VIEW 
Trending nowThis is a popular solution!

Step by stepSolved in 8 steps with 15 images

Knowledge Booster

Similar questions
- Please answer the following including the conditions that need to be met and how to compute the answer using a graphing calculator. Thank you.arrow_forwardA colleague of yours is faced with testing a relationship at the .05 level or significance or the .01 level of significance. What is your advice to your colleague? Why?arrow_forwardWhat is the nature of the relationship between population size and murder rate? Use the below chart to discuss. Are there outliers? Might they be driving this pattern?arrow_forward
- Suppose you have access to a database with the variables listed below. Choose two variables you are interested in exploring that may be related (a predictor and outcome). Which variable is your y (outcome) and which is your x (predictor)? *Hint: which one may predict the other? Example: hot weather may predict sunburns.arrow_forwardFor the following line graph, State at least one type of conclusion that could be made from the data provided for the KPI. Suggest one other data source that would provide more information to make data-driven decisions. Explain what information that source would supply. (I used the clustered bar chart) Examples: 1) The completion KPI measures the percentage of South Texas College students who finished their degree or certificate program within six years. From the line graph, it can be seen that the completion rates have remained nearly constant through the years. Data from the THECB was used in this case. 2) Information about the percentage of students who receive credit for attempted courses is available on the South Texas College KPI webpage. According to the data, over the past five years, an increasing number of students have been receiving credit for courses they have attempted. Data on the percentage of students who complete courses, the percentage of students who withdraw…arrow_forwardOnly data that shows positive trends can be graphed in a scatter diagram. True O Falsearrow_forward
- A major software company is considering a price increase on its most popular product. They are currently selling below their competitor’s price. Someone from the Brand team suggested they check consumer response before making a price increase. You are called into explain how this marketing research might be carried out. In terms of qualitative and quantitative options you tell them...arrow_forwardPART D TO BE ANSWERED! Thank you!arrow_forwardBUSINESS STATISTICS PROBLEM image attached: please help, thank youarrow_forward
- a. Make the case with graphs and numbers that women are a growing presence in the U.S. military. b. Make the case with graphs and numbers that women are a declining presence in the U.S. military. c. Write a paragraph that gives a balanced picture of the changing presence of women in the military using appropriate statistics to make your points. What additional data would be helpful?arrow_forwardChoose a correct statement. Leverage means a gap between a data point that is unusual in OLS models. O Discrepancy means how far away an observation is from other observations. c. Cook's distance measures discrepancy. Influential outliers can be calculated by discrepancy X leverage. O Cook's distance measures discrepancy.arrow_forward
arrow_back_ios
arrow_forward_ios
Recommended textbooks for you
- MATLAB: An Introduction with ApplicationsStatisticsISBN:9781119256830Author:Amos GilatPublisher:John Wiley & Sons Inc
 Probability and Statistics for Engineering and th...StatisticsISBN:9781305251809Author:Jay L. DevorePublisher:Cengage Learning
 Statistics for The Behavioral Sciences (MindTap C...StatisticsISBN:9781305504912Author:Frederick J Gravetter, Larry B. WallnauPublisher:Cengage Learning
  Elementary Statistics: Picturing the World (7th E...StatisticsISBN:9780134683416Author:Ron Larson, Betsy FarberPublisher:PEARSON
 The Basic Practice of StatisticsStatisticsISBN:9781319042578Author:David S. Moore, William I. Notz, Michael A. FlignerPublisher:W. H. Freeman
 Introduction to the Practice of StatisticsStatisticsISBN:9781319013387Author:David S. Moore, George P. McCabe, Bruce A. CraigPublisher:W. H. Freeman
MATLAB: An Introduction with Applications
Statistics
ISBN:9781119256830
Author:Amos Gilat
Publisher:John Wiley & Sons Inc
Probability and Statistics for Engineering and th...
Statistics
ISBN:9781305251809
Author:Jay L. Devore
Publisher:Cengage Learning
Statistics for The Behavioral Sciences (MindTap C...
Statistics
ISBN:9781305504912
Author:Frederick J Gravetter, Larry B. Wallnau
Publisher:Cengage Learning
Elementary Statistics: Picturing the World (7th E...
Statistics
ISBN:9780134683416
Author:Ron Larson, Betsy Farber
Publisher:PEARSON
The Basic Practice of Statistics
Statistics
ISBN:9781319042578
Author:David S. Moore, William I. Notz, Michael A. Fligner
Publisher:W. H. Freeman
Introduction to the Practice of Statistics
Statistics
ISBN:9781319013387
Author:David S. Moore, George P. McCabe, Bruce A. Craig
Publisher:W. H. Freeman