MATLAB: An Introduction with Applications
6th Edition
ISBN: 9781119256830
Author: Amos Gilat
Publisher: John Wiley & Sons Inc
expand_more
expand_more
format_list_bulleted
Question

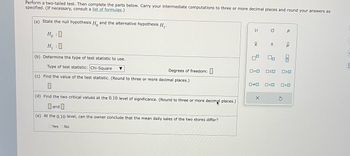
Transcribed Image Text:Perform a two-tailed test. Then complete the parts below. Carry your intermediate computations to three or more decimal places and round your answers as
specified. (If necessary, consult a list of formulas.)
(a) State the null hypothesis Ho and the alternative hypothesis H₁.
HO
H₁ :0
(b) Determine the type of test statistic to use.
Type of test statistic: Chi-Square
(c) Find the value of the test statistic. (Round to three or more decimal places.)
▼
Yes No
Degrees of freedom:
(d) Find the two critical values at the 0.10 level of significance. (Round to three or more decimal places.)
and
(e) At the 0.10 level, can the owner conclude that the mean daily sales of the two stores differ?
μ
|x
9
0=0
O
X
S
OSO
P
2
010
<Q
020
0*0 0<0 0>0
3
E

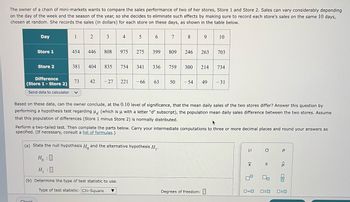
Transcribed Image Text:The owner of a chain of mini-markets wants to compare the sales performance of two of her stores, Store 1 and Store 2. Sales can vary considerably depending
on the day of the week and the season of the year, so she decides to eliminate such effects by making sure to record each store's sales on the same 10 days,
chosen at random. She records the sales (in dollars) for each store on these days, as shown in the table below.
34
5 6
789 10
Day
Store 1
Store 2
Difference
(Store 1 - Store 2)
Send data to calculator
Check
1
454
381
73
2
446
808 975
404 835
275
754 341
42 -27 221 -66
399
7
809 246 263 703
336 759
(a) State the null hypothesis H and the alternative hypothesis H₁.
HO
H₁:0
(b) Determine the type of test statistic to use.
Type of test statistic: Chi-Square
63 50
300 214 734
Based on these data, can the owner conclude, at the 0.10 level of significance, that the mean daily sales of the two stores differ? Answer this question by
performing a hypothesis test regarding (which is u with a letter "d" subscript), the population mean daily sales difference between the two stores. Assume
that this population of differences (Store 1 minus Store 2) is normally distributed.
+
Perform a two-tailed test. Then complete the parts below. Carry your intermediate computations to three or more decimal places and round your answers as
specified. (If necessary, consult a list of formulas.)
-54 49 -31
Degrees of freedom:
н
X
O
S
00
Р
<Q
ola
0=0 OSO 020
Expert Solution
This question has been solved!
Explore an expertly crafted, step-by-step solution for a thorough understanding of key concepts.
Step by stepSolved in 4 steps with 4 images

Knowledge Booster
Similar questions
- Test the hypothesis using the P-value approach. Be sure to verify the requirements of the test. Ho: p= 0.6 versus H1: p> 0.6 n= 200; x = 125; a = 0.05 Click here to view page 1 of the table. Click here to view page 2 of the table. Calculate the test statistic, Zo. %D (Round to two decimal places as needed.) Identify the P-value. P-value = (Round to three decimal places as needed.) Choose the correct result of the hypothesis test for the P-value approach below. A. Do not reject the null hypothesis, because the P-value is greater than a. B. Reject the null hypothesis, because the P-value is greater than o. C. Reject the null hypothesis, because the P-value is less than a. D. Do not reject the null hypothesis, because the P-value is less than a.arrow_forwardSelect the null hypothesis Ho: Males and females do not differ in the amount of money they have on them Ho: Males and females will differ in the amount of money they have on themarrow_forward+ 2 E I A Read aloud Draw Highlight Erase 26. The student senate at a local university is about to hold elections. A representative from the women's sports program and a representative from the men's sports program must both be elected. Two candidates, an incumbent and a challenger, are vying for each position and early polling results are presented next. A hypothesis test must be performed to determine whether the percentages of supportipg votes are different between the two incumbent candidates. In a sample of 100voters, 67 said that they would vote for the women's incumbent candidate. In a separate sample of 100 voters, 55 said they would vote for the men's incumbent candidate. Let p1 and p2 be the proportions of supporting votes for the incumbent candidates representing women's and men's sports programs, respectively. Which of the following are the competing hypotheses to determine whether the percentages of supporting votes are different between the two incumbent candidates? А.…arrow_forward
- Inferential Statistics Are the M&M’s weights accurate? According to the package, each small bag of peanut M&M’s should weigh 49.3 grams. To determine if the bag weights are on target, use the weight of the bags of M&M’s and conduct a hypothesis test to see if the company’s claim is true. Using α = .05 and the five-step process, be sure to include your hypotheses and work. Calculate the corresponding confidence interval for the mean of the weights. Does your results and decision in this problem match the decision you made in Problem 5? Is the average number of orange M&M’s in a bag different from the average number of brown M&M’s? Conduct a hypothesis test at the α = .05 level to answer that question. The following data set includes information from 30 bags of M&M’s. For each bag, the count for each color is provided as well as the bag’s weight prior to it being open. Bag # Red Green Blue Orange Yellow Brown Weight 1…arrow_forwardI need identifying the P value.arrow_forwardThe null and alternative hypotheses are given. Determine whether the hypothesis test is left-tailed, right-tailed, or two-tailed. What parameter is being tested? μ = 8 Ho: H₁: μ < 8 What type of test is being conducted in this problem? Two-tailed test Right-tailed test Left-tailed test What parameter is being tested? Population mean Population standard deviation Population proportionarrow_forward
- Test the hypothesis using the P-value approach. Be sure to verify the requirements of the test. H0: p=0.72 versus H1: p≠0.72 n=500, x=350, a=0.01arrow_forwardTest the hypothesis using the P-value approach. Be sure to verify the requirements of the test. H0: p=0.81 versus H1: p≠0.81 n=500, x=390, a=0.01 find p valuearrow_forwardTest the hypothesis using the P-value approach. Be sure to verify the requirements of the test. H0: p=0.79 versus H1: p≠0.79 n=500, x=390, a=0.01arrow_forward
- Test the hypothesis using the P-value approach. Be sure to verify the requirements of the test. Ho:p = 0.5 versus H,: p>0.5 n= 200; x = 120, a = 0.05 Use technology to find the P-value. P-value = (Round to three decimal places as needed.)arrow_forwardScenario: 200 people were asked, “Who is your favorite superhero?” Below are the data. Test the null hypothesis that the population frequencies for each category are equal. α= .05. Iron Man Black Panther Wonder Woman Spiderman fo = 40 fo = 60 fo =55 fo = 45 fe = fe = fe = fe = What is the correct result based on the data?arrow_forwardD iew an example Get more help. V Use technology to find the P-value for the hypothesis test described below. The claim is that for a smartphone carrier's data speeds at airports, the mean is μ = 17.00 Mbps. The sample size is n = 16 and the test statistic is t= -2.084. P-value= (Round to three decimal places as needed.) X # 3 E 80 I D C $ 4 ƠN F4 R F V 07 20 % 5 J T G 6 B MacBook Air F6 Y H & 7 F7 U N * 00 8 J DII F8 - M ( 9 K F9 O ) < I H O L 72 Clear all P. V ▾ F11 { سال = [ command optionarrow_forward
arrow_back_ios
SEE MORE QUESTIONS
arrow_forward_ios
Recommended textbooks for you
 MATLAB: An Introduction with ApplicationsStatisticsISBN:9781119256830Author:Amos GilatPublisher:John Wiley & Sons Inc
 Probability and Statistics for Engineering and th...StatisticsISBN:9781305251809Author:Jay L. DevorePublisher:Cengage Learning
 Statistics for The Behavioral Sciences (MindTap C...StatisticsISBN:9781305504912Author:Frederick J Gravetter, Larry B. WallnauPublisher:Cengage Learning
 Elementary Statistics: Picturing the World (7th E...StatisticsISBN:9780134683416Author:Ron Larson, Betsy FarberPublisher:PEARSON
 The Basic Practice of StatisticsStatisticsISBN:9781319042578Author:David S. Moore, William I. Notz, Michael A. FlignerPublisher:W. H. Freeman
 Introduction to the Practice of StatisticsStatisticsISBN:9781319013387Author:David S. Moore, George P. McCabe, Bruce A. CraigPublisher:W. H. Freeman

MATLAB: An Introduction with Applications
Statistics
ISBN:9781119256830
Author:Amos Gilat
Publisher:John Wiley & Sons Inc

Probability and Statistics for Engineering and th...
Statistics
ISBN:9781305251809
Author:Jay L. Devore
Publisher:Cengage Learning

Statistics for The Behavioral Sciences (MindTap C...
Statistics
ISBN:9781305504912
Author:Frederick J Gravetter, Larry B. Wallnau
Publisher:Cengage Learning

Elementary Statistics: Picturing the World (7th E...
Statistics
ISBN:9780134683416
Author:Ron Larson, Betsy Farber
Publisher:PEARSON

The Basic Practice of Statistics
Statistics
ISBN:9781319042578
Author:David S. Moore, William I. Notz, Michael A. Fligner
Publisher:W. H. Freeman

Introduction to the Practice of Statistics
Statistics
ISBN:9781319013387
Author:David S. Moore, George P. McCabe, Bruce A. Craig
Publisher:W. H. Freeman