
Functions and Change: A Modeling Approach to College Algebra (MindTap Course List)
6th Edition
ISBN: 9781337111348
Author: Bruce Crauder, Benny Evans, Alan Noell
Publisher: Cengage Learning
expand_more
expand_more
format_list_bulleted
Related questions
Question
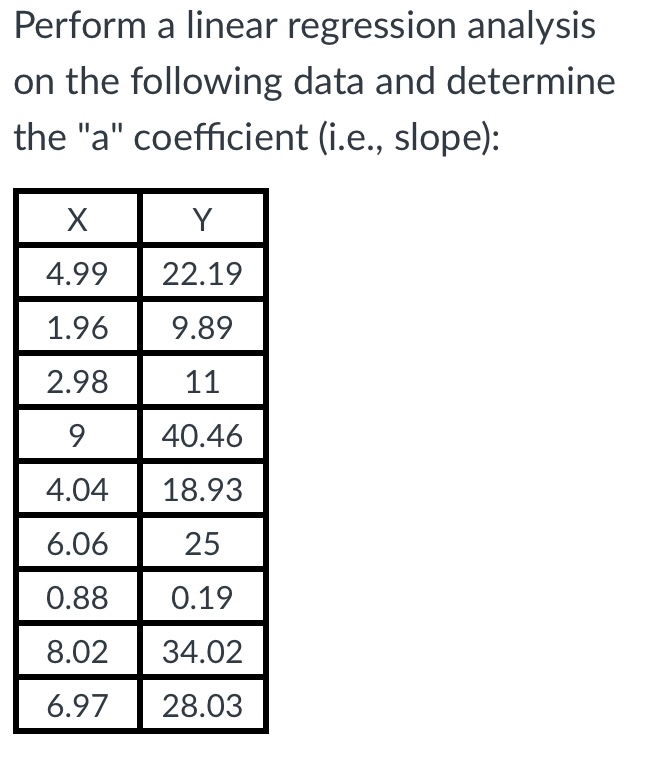

Transcribed Image Text:Perform a linear regression analysis
on the following data and determine
the "a" coefficient (i.e., slope):
Y
4.99
22.19
1.96
9.89
2.98
11
9
40.46
4.04
18.93
6.06
25
0.88
0.19
8.02
34.02
6.97
28.03
Expert Solution
This question has been solved!
Explore an expertly crafted, step-by-step solution for a thorough understanding of key concepts.

This is a popular solution

Trending nowThis is a popular solution!

Step by stepSolved in 3 steps with 2 images

Knowledge Booster

Similar questions
- Find the mean hourly cost when the cell phone described above is used for 240 minutes.arrow_forwardLife Expectancy The following table shows the average life expectancy, in years, of a child born in the given year42 Life expectancy 2005 77.6 2007 78.1 2009 78.5 2011 78.7 2013 78.8 a. Find the equation of the regression line, and explain the meaning of its slope. b. Plot the data points and the regression line. c. Explain in practical terms the meaning of the slope of the regression line. d. Based on the trend of the regression line, what do you predict as the life expectancy of a child born in 2019? e. Based on the trend of the regression line, what do you predict as the life expectancy of a child born in 1580?2300arrow_forwardFor the following exercises, use Table 4 which shows the percent of unemployed persons 25 years or older who are college graduates in a particular city, by year. Based on the set of data given in Table 5, calculate the regression line using a calculator or other technology tool, and determine the correlation coefficient. Round to three decimal places of accuracyarrow_forward
- The US. import of wine (in hectoliters) for several years is given in Table 5. Determine whether the trend appearslinear. Ifso, and assuming the trend continues, in what year will imports exceed 12,000 hectoliters?arrow_forwardFind the regression line of the points: (12.7, 18.7), (9.1, 17.2), (15.3, 14.5), (19.5, 12.9)arrow_forwardA regression was run using 11 subjects to determine if there is a relationship between hours of TV watched per day (x) and number of situps a person can do (y).The results of the regression were: Regression Equation....... y=b0+b1xy=b0+b1x Slope..................... b1=−1.282b1=-1.282 y-Intercept............... b0=38.871b0=38.871 Sample size............... n=11n=11 Correlation Coefficient... r=−0.79r=-0.79 Use this to predict the number of situps a person who watches 1 hours of TV can do (to one decimal place)arrow_forward
- When a linear regression for the growth of the number of employees in the health care and social assistance fields in Quebec from 2010 to 2014 is performed, the following values are determined: r=0.9948 r2=0.9897 These values indicate that a linear model is a good fit for the data. True Falsearrow_forwardType the regression equation for “Area” and “Biomass” in context into your document. Interpret the slope of the regression line (in context of this data set) for “Area” and “Biomass”. is it meaningful to interpret the y-intercept for “Area” and “Biomass”? Why or why not?arrow_forwardA regression line calculated as y= 9.7-3.2x. The slope of this line is -3.2 TRUE OR FALSEarrow_forward
- A regression was run to determine if there is a relationship between hours of TV watched per day (x) and number of situps a person can do (y).The results of the regression were:y=ax+b a=-0.96 b=35.944 r2=0.736164 r=-0.858 Use this to predict the number of situps a person who watches 10.5 hours of TV can do (to one decimal place)arrow_forwardA regression was run to determine if there is a relationship between hours of TV watched per day (x) and number of situps a person can do (y).The results of the regression were: y=ax+b a=-1.383 b=24.599 r2=0.962361 r=-0.981 Use this to predict the number of situps a person who watches 5.5 hours of TV can do (to one decimal place)arrow_forwardThe following regression model shows the relationship between selling price of a house(y) and the number of bedrooms(x); y=100+0.6x. Another separate regression between selling price of the house(y) and the level of crime per week in the neighborhood(x); y=100+0.3x. Draw the regression line for the first and second regression. Write an interpretation for the slope coefficient in the first and second regression. Be specific. What is the estimated value of the price of a house which has two bedrooms.arrow_forward
arrow_back_ios
SEE MORE QUESTIONS
arrow_forward_ios
Recommended textbooks for you
- Functions and Change: A Modeling Approach to Coll...AlgebraISBN:9781337111348Author:Bruce Crauder, Benny Evans, Alan NoellPublisher:Cengage Learning
 Glencoe Algebra 1, Student Edition, 9780079039897...AlgebraISBN:9780079039897Author:CarterPublisher:McGraw Hill
 College Algebra (MindTap Course List)AlgebraISBN:9781305652231Author:R. David Gustafson, Jeff HughesPublisher:Cengage Learning

 Trigonometry (MindTap Course List)TrigonometryISBN:9781337278461Author:Ron LarsonPublisher:Cengage Learning
Functions and Change: A Modeling Approach to Coll...
Algebra
ISBN:9781337111348
Author:Bruce Crauder, Benny Evans, Alan Noell
Publisher:Cengage Learning
Glencoe Algebra 1, Student Edition, 9780079039897...
Algebra
ISBN:9780079039897
Author:Carter
Publisher:McGraw Hill
College Algebra (MindTap Course List)
Algebra
ISBN:9781305652231
Author:R. David Gustafson, Jeff Hughes
Publisher:Cengage Learning
Trigonometry (MindTap Course List)
Trigonometry
ISBN:9781337278461
Author:Ron Larson
Publisher:Cengage Learning