
MATLAB: An Introduction with Applications
6th Edition
ISBN: 9781119256830
Author: Amos Gilat
Publisher: John Wiley & Sons Inc
expand_more
expand_more
format_list_bulleted
Related questions
Question
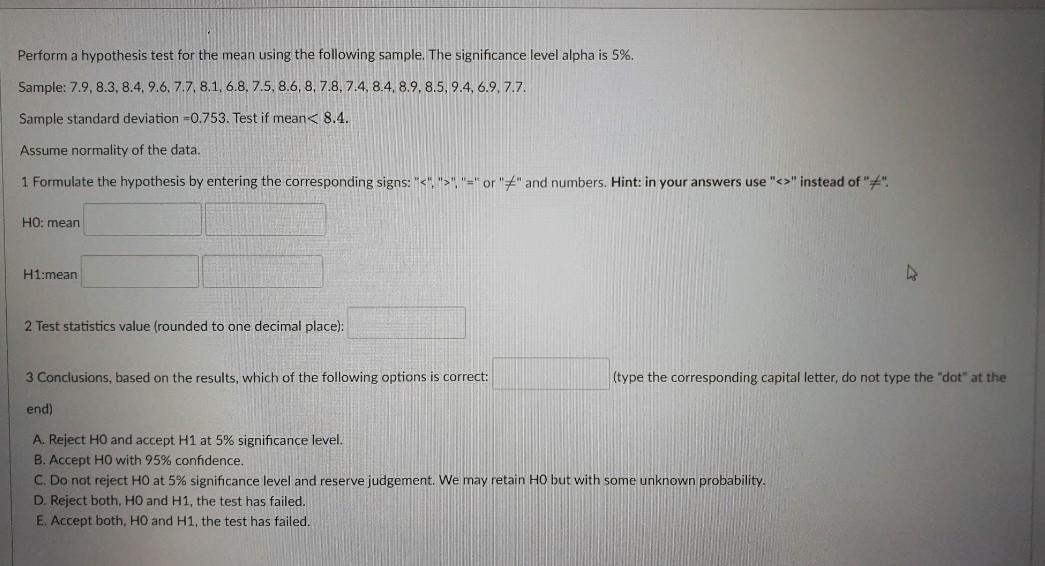

Transcribed Image Text:Perform a hypothesis test for the mean using the following sample. The significance level alpha is 5%.
Sample: 7.9, 8.3, 8.4, 9.6, 7.7, 8.1, 6.8, 7.5, 8.6, 8, 7.8, 7.4, 8.4, 8.9, 8.5, 9.4, 6.9, 7.7.
Sample standard deviation =0.753. Test if mean< 8.4.
Assume normality of the data.
1 Formulate the hypothesis by entering the corresponding signs: "<", ">", "=" or "" and numbers. Hint: in your answers use "<>" instead of "".
HO: mean
H1:mean
2 Test statistics value (rounded to one decimal place):
3 Conclusions, based on the results, which of the following options is correct:
(type the corresponding capital letter, do not type the "dot" at the
end)
A. Reject HO and accept H1 at 5% significance level.
B. Accept HO with 95% confidence.
C. Do not reject HO at 5% significance level and reserve judgement. We may retain HO but with some unknown probability.
D. Reject both, HO and H1, the test has failed.
E. Accept both, HO and H1, the test has failed.
Expert Solution
This question has been solved!
Explore an expertly crafted, step-by-step solution for a thorough understanding of key concepts.

Step by stepSolved in 2 steps with 2 images

Knowledge Booster

Similar questions
- calculate the standard deviation for the following sample data 2,4,5,5,7,8,9,10,11,12arrow_forwardUse the magnitudes (Richter scale) of the 120 earthquakes listed in the accompanying data table. Use technology to find the range, variance, and standard deviation. If another value, 8.00, is added to those listed in the data set, do the measures of variation change much? 3.272.452.542.432.752.372.192.421.911.432.851.731.992.322.332.704.742.873.382.722.833.423.952.993.873.473.082.942.703.602.842.373.033.232.593.643.242.662.352.432.813.952.522.922.983.412.272.562.933.162.201.151.934.002.542.832.352.311.522.801.951.602.452.332.081.553.201.491.812.551.662.352.452.082.192.752.002.792.392.671.692.881.841.991.862.561.972.183.671.553.162.461.881.502.793.283.822.752.452.712.541.642.183.032.361.481.922.322.651.411.391.802.242.302.481.732.402.442.482.44arrow_forwardSegments - Clementines are a type of hybrid orange introduced into Florida by the United States Department of Agriculture in 1909. Historically, on average, a clementine has 10.25 segments. A fruit lover bought 100 clementines and found a mean number of 10.66 segments and a standard deviation of 2.0712 segments. The fruit lover wonders if the actual mean number of segments is more than the historic value and wants to carry out a hypothesis test. What is the test statistic for this hypothesis test? Give your answer to 4 decimal places. Your Answer: Ancworarrow_forward
- The following are the normalized levels of a critical protein in 12 samples of blood: 8.2 , 4.7 , 10.3 , 11.7 , 18.3 , 5.9 , 3.8 , 18.9 , 7.6 , 14.2 , 9.8 , 16.4 Compute the sample mean, the sample median, and the sample standard deviation.arrow_forwardBeer Drinking. The mean annual consumption of beer per person in the US is 22.0 gallons . A random sample of 300 Washington D.C. residents yielded a mean annual beer consumption of 27.8 gallons. At the 10% significance level, do the data provide sufficient evidence to conclude that the mean annual consumption of beer per person for the nation’s capital differs from the national mean? Assume that the standard deviation of annual beer consumption for Washington D.C. residents is 55 gallons.arrow_forwardUse the magnitudes (Richter scale) of the 120 earthquakes listed in the accompanying data table. Use technology to find the range, variance, and standard deviation. If another value, 8.00, is added to those listed in the data set, do the measures of variation change much? 3.30 2.77 2.80 1.96 1.69 2.54 2.43 3.44 3.92 1.58 2.87 1.63 2.56 3.95 2.50 2.44 1.82 2.19 2.44 2.99 2.92 2.35 1.98 3.06 2.78 3.86 2.95 2.07 1.86 2.36 2.37 3.46 3.45 1.54 2.54 1.49 2.22 3.06 2.27 3.20 1.96 1.91 2.40 2.95 2.61 1.49 2.16 2.33 1.91 2.70 2.92 1.80 3.66 2.69 1.43 3.60 3.13 2.56 1.54 1.41 2.83 2.85 2.20 1.68 3.18 1.38 1.73 2.37 1.15 2.35 2.46 1.81 2.01 3.00 1.94 2.42 1.85 2.24 2.35 3.22 3.97 2.10 1.48 2.31 2.31 2.62 2.55 2.20 2.77 2.46 2.69 3.57 2.84 2.75 3.26 1.74 4.72 3.23 2.36 2.00 3.83 2.41 2.88 2.67 2.32 2.80 2.80 2.40 3.41 2.34 1.49 2.41 2.45 2.50 2.73 2.44 2.78 2.65 2.68 2.43 Without the extra data value, the range is 3.573.57. (Type an integer or…arrow_forward
- 1. Find the sample standard deviation from the following data. 1420,1223,988,694,730,836,721,742,541,623,1449,950 2., Construct a 99%confidence interval for the population mean μ.arrow_forwardA newspaper article reported that the typical American family spent an average of $86.79 for Halloween candy and costumes last year. A sample of N = 16 families this year reported spending a mean of M = $90, with s = $21. What statistical test would be used to determine whether these data indicate a significant change in holiday spending? single-sample t test z test effect-size test paired-samples t testarrow_forward
arrow_back_ios
arrow_forward_ios
Recommended textbooks for you
- MATLAB: An Introduction with ApplicationsStatisticsISBN:9781119256830Author:Amos GilatPublisher:John Wiley & Sons Inc
 Probability and Statistics for Engineering and th...StatisticsISBN:9781305251809Author:Jay L. DevorePublisher:Cengage Learning
 Statistics for The Behavioral Sciences (MindTap C...StatisticsISBN:9781305504912Author:Frederick J Gravetter, Larry B. WallnauPublisher:Cengage Learning
  Elementary Statistics: Picturing the World (7th E...StatisticsISBN:9780134683416Author:Ron Larson, Betsy FarberPublisher:PEARSON
 The Basic Practice of StatisticsStatisticsISBN:9781319042578Author:David S. Moore, William I. Notz, Michael A. FlignerPublisher:W. H. Freeman
 Introduction to the Practice of StatisticsStatisticsISBN:9781319013387Author:David S. Moore, George P. McCabe, Bruce A. CraigPublisher:W. H. Freeman
MATLAB: An Introduction with Applications
Statistics
ISBN:9781119256830
Author:Amos Gilat
Publisher:John Wiley & Sons Inc
Probability and Statistics for Engineering and th...
Statistics
ISBN:9781305251809
Author:Jay L. Devore
Publisher:Cengage Learning
Statistics for The Behavioral Sciences (MindTap C...
Statistics
ISBN:9781305504912
Author:Frederick J Gravetter, Larry B. Wallnau
Publisher:Cengage Learning
Elementary Statistics: Picturing the World (7th E...
Statistics
ISBN:9780134683416
Author:Ron Larson, Betsy Farber
Publisher:PEARSON
The Basic Practice of Statistics
Statistics
ISBN:9781319042578
Author:David S. Moore, William I. Notz, Michael A. Fligner
Publisher:W. H. Freeman
Introduction to the Practice of Statistics
Statistics
ISBN:9781319013387
Author:David S. Moore, George P. McCabe, Bruce A. Craig
Publisher:W. H. Freeman