MATLAB: An Introduction with Applications
6th Edition
ISBN: 9781119256830
Author: Amos Gilat
Publisher: John Wiley & Sons Inc
expand_more
expand_more
format_list_bulleted
Topic Video
Question
Check the model The mean of the 100 car speeds in Ex-
ercise 20 was 23.84 mph, with a standard deviation of
ercise 20 was 23.84 mph, with a standard deviation of
3.56 mph.
a) Using a Normal model, what values should border the
middle 95% of all car speeds?
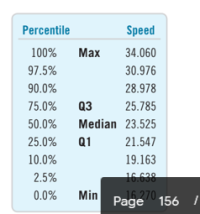
b) Here are some summary statistics.From your answer in part a, how well does the model
do in predicting those percentiles? Are you surprised?
Explain.
a) Using a Normal model, what values should border the
middle 95% of all car speeds?
b) Here are some summary statistics.From your answer in part a, how well does the model
do in predicting those percentiles? Are you surprised?
Explain.

Transcribed Image Text:Percentile
Speed
100%
Max
34.060
97.5%
30.976
90.0%
28.978
75.0%
Q3
25.785
50.0%
Median 23.525
25.0%
Q1
21.547
10.0%
19.163
16.638
2.5%
0.0%
Page 0 156 T
Min
Expert Solution
This question has been solved!
Explore an expertly crafted, step-by-step solution for a thorough understanding of key concepts.
This is a popular solution
Trending nowThis is a popular solution!
Step by stepSolved in 2 steps with 3 images

Knowledge Booster
Learn more about
Need a deep-dive on the concept behind this application? Look no further. Learn more about this topic, statistics and related others by exploring similar questions and additional content below.Similar questions
- Use the following data to answer the following questions: 101.4, 150.1, 134.8, 139.2, 125.7 1. The mean value is __________. 2. The median value is __________. 3. The mode is __________. 4. The range is __________.arrow_forwardQUESTION 3 What percent of scores are below an SAT score of 560?arrow_forwardThe full question didn't fit in one part so I attached 2 photos.arrow_forward
- Cereals sodium values have a mean of 167 and a standard deviation of 77.3. Find the z-score for the cereal that has a sodium value of 0. How would you interpret this z-score?arrow_forwardUsing PivotTables, find the mean and standard deviation of sales by region in the data provided. LOADING... Click the icon to view the data. Question content area bottom Part 1 Complete the table below. (Type integers or decimals rounded to two decimal places as needed.) Average of Amount StdDev of Amount East enter your response here enter your response here North enter your response here enter your response here South enter your response here enter your response here West enter your response here enter your response here Grand Total enter your response here enter your response herearrow_forwardPlease discuss the concepts of Mean, Median, Mode, and Standard Deviation, including when each should be used, and evaluate the differences of each. How can knowing this information about data help us?arrow_forward
- QUESTION 7 Given an x-mean3D3.4, SSx-97.3, y-mean33.9, SSy-45.2, Sxy-55.5, and a sample size of 45, calculate the following: X Sample Standard Deviation and Y Sample Standard Deviation X Population Standard Deviation and Y Population Standard Deviation Sample Covariance and Population Covariance Sample Correlation and Population Correlationarrow_forwardWhich of these is an advantage of using a transformed score when reporting the score of an individual case? a. Transformed scores will allow the mean score to be reported. b. Transformed scores will be reported on the nominal level. c. Transformed scores provide a context for the individual's score d. Transformed scores provide a measure of variability.arrow_forwardThe mean score for first exam in your first organic chemistry class (section A) was 60, with a standard deviation of 5. Your score on the exam was 70. A. How many standard deviations above the mean is your score?arrow_forward
- What is the correct way to report the results in APA stylearrow_forwardz Scores LeBron James, one of the most successful basketball players of all time, has a height of 6 feet 8 inches, or 203 cm. Based on statistics from Data Set 1 “Body Data” in Appendix B, his height converts to the z score of 4.07. How many standard deviations is his height above the mean?arrow_forwardQUESTION 2 What percent of scores are above an ACT score of 19?arrow_forward
arrow_back_ios
SEE MORE QUESTIONS
arrow_forward_ios
Recommended textbooks for you
 MATLAB: An Introduction with ApplicationsStatisticsISBN:9781119256830Author:Amos GilatPublisher:John Wiley & Sons Inc
 Probability and Statistics for Engineering and th...StatisticsISBN:9781305251809Author:Jay L. DevorePublisher:Cengage Learning
 Statistics for The Behavioral Sciences (MindTap C...StatisticsISBN:9781305504912Author:Frederick J Gravetter, Larry B. WallnauPublisher:Cengage Learning
 Elementary Statistics: Picturing the World (7th E...StatisticsISBN:9780134683416Author:Ron Larson, Betsy FarberPublisher:PEARSON
 The Basic Practice of StatisticsStatisticsISBN:9781319042578Author:David S. Moore, William I. Notz, Michael A. FlignerPublisher:W. H. Freeman
 Introduction to the Practice of StatisticsStatisticsISBN:9781319013387Author:David S. Moore, George P. McCabe, Bruce A. CraigPublisher:W. H. Freeman

MATLAB: An Introduction with Applications
Statistics
ISBN:9781119256830
Author:Amos Gilat
Publisher:John Wiley & Sons Inc

Probability and Statistics for Engineering and th...
Statistics
ISBN:9781305251809
Author:Jay L. Devore
Publisher:Cengage Learning

Statistics for The Behavioral Sciences (MindTap C...
Statistics
ISBN:9781305504912
Author:Frederick J Gravetter, Larry B. Wallnau
Publisher:Cengage Learning

Elementary Statistics: Picturing the World (7th E...
Statistics
ISBN:9780134683416
Author:Ron Larson, Betsy Farber
Publisher:PEARSON

The Basic Practice of Statistics
Statistics
ISBN:9781319042578
Author:David S. Moore, William I. Notz, Michael A. Fligner
Publisher:W. H. Freeman

Introduction to the Practice of Statistics
Statistics
ISBN:9781319013387
Author:David S. Moore, George P. McCabe, Bruce A. Craig
Publisher:W. H. Freeman