MATLAB: An Introduction with Applications
6th Edition
ISBN: 9781119256830
Author: Amos Gilat
Publisher: John Wiley & Sons Inc
expand_more
expand_more
format_list_bulleted
Concept explainers
Question

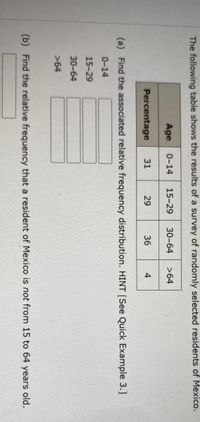
Transcribed Image Text:### Survey Results of Residents in Mexico
The table below presents the age distribution of a survey conducted on randomly selected residents of Mexico.
| Age Group | Percentage |
|-----------|------------|
| 0-14 | 31% |
| 15-29 | 29% |
| 30-64 | 36% |
| >64 | 4% |
**Tasks:**
(a) **Relative Frequency Distribution:**
Calculate the associated relative frequency distribution. Refer to Quick Example 3 for guidance.
- 0-14
- 15-29
- 30-64
- >64
(b) **Specific Relative Frequency Calculation:**
Determine the relative frequency that a resident of Mexico is **not** between the ages of 15 to 64 years old.
This information provides insights into the age demographics of the population in Mexico, useful for educational and planning purposes.
Expert Solution
This question has been solved!
Explore an expertly crafted, step-by-step solution for a thorough understanding of key concepts.
This is a popular solution
Trending nowThis is a popular solution!
Step by stepSolved in 2 steps

Knowledge Booster
Learn more about
Need a deep-dive on the concept behind this application? Look no further. Learn more about this topic, statistics and related others by exploring similar questions and additional content below.Similar questions
- 21arrow_forwardA survey of 267 restaurant owners and managers was released by Long Range Systems, LLC (LRS), a leading supplier of technology that enhances the guest experience for businesses. According to the study, the average wait per party is 23 minutes. You suspect the wait time at your favorite local restaurant is longer than the industry standard. You survey a random sample of 30 customers which yields an average wait time of 27 minutes with a standard deviation of 12.1 minutes. Is there evidence to say that your favorite local restaurant has a longer average wait time than 23 minutes? What type of error might have been made?arrow_forwardFind the value of X to the nearest 10tharrow_forward
arrow_back_ios
arrow_forward_ios
Recommended textbooks for you
 MATLAB: An Introduction with ApplicationsStatisticsISBN:9781119256830Author:Amos GilatPublisher:John Wiley & Sons Inc
 Probability and Statistics for Engineering and th...StatisticsISBN:9781305251809Author:Jay L. DevorePublisher:Cengage Learning
 Statistics for The Behavioral Sciences (MindTap C...StatisticsISBN:9781305504912Author:Frederick J Gravetter, Larry B. WallnauPublisher:Cengage Learning
 Elementary Statistics: Picturing the World (7th E...StatisticsISBN:9780134683416Author:Ron Larson, Betsy FarberPublisher:PEARSON
 The Basic Practice of StatisticsStatisticsISBN:9781319042578Author:David S. Moore, William I. Notz, Michael A. FlignerPublisher:W. H. Freeman
 Introduction to the Practice of StatisticsStatisticsISBN:9781319013387Author:David S. Moore, George P. McCabe, Bruce A. CraigPublisher:W. H. Freeman

MATLAB: An Introduction with Applications
Statistics
ISBN:9781119256830
Author:Amos Gilat
Publisher:John Wiley & Sons Inc

Probability and Statistics for Engineering and th...
Statistics
ISBN:9781305251809
Author:Jay L. Devore
Publisher:Cengage Learning

Statistics for The Behavioral Sciences (MindTap C...
Statistics
ISBN:9781305504912
Author:Frederick J Gravetter, Larry B. Wallnau
Publisher:Cengage Learning

Elementary Statistics: Picturing the World (7th E...
Statistics
ISBN:9780134683416
Author:Ron Larson, Betsy Farber
Publisher:PEARSON

The Basic Practice of Statistics
Statistics
ISBN:9781319042578
Author:David S. Moore, William I. Notz, Michael A. Fligner
Publisher:W. H. Freeman

Introduction to the Practice of Statistics
Statistics
ISBN:9781319013387
Author:David S. Moore, George P. McCabe, Bruce A. Craig
Publisher:W. H. Freeman