
MATLAB: An Introduction with Applications
6th Edition
ISBN: 9781119256830
Author: Amos Gilat
Publisher: John Wiley & Sons Inc
expand_more
expand_more
format_list_bulleted
Related questions
Question
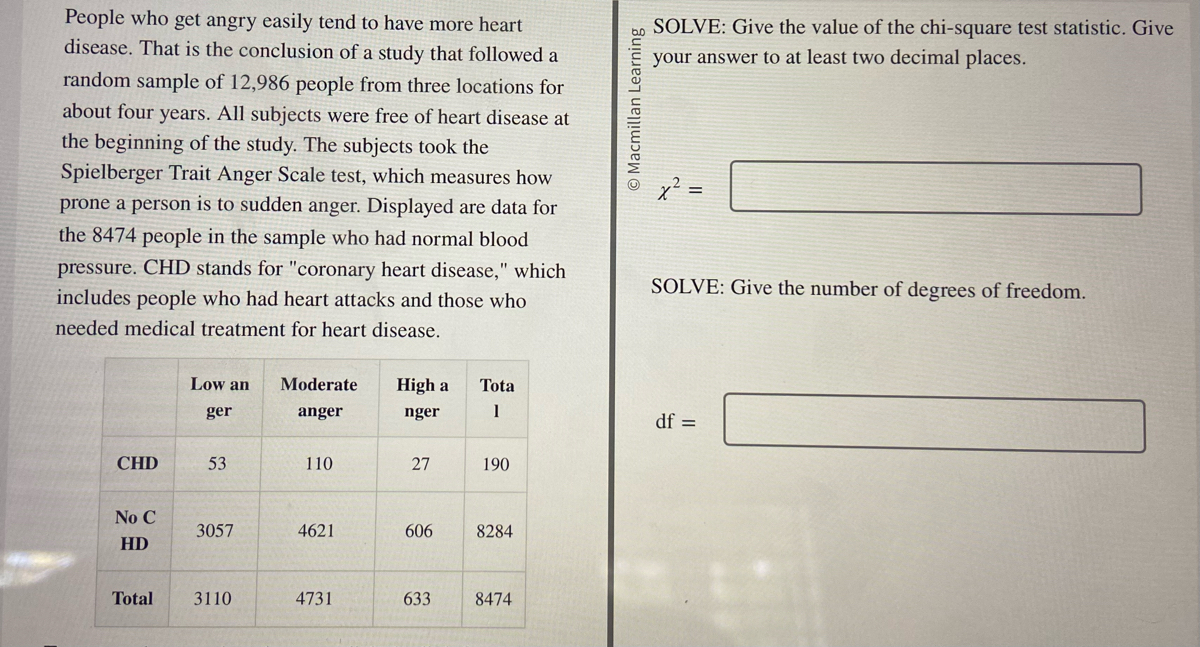

Transcribed Image Text:People who get angry easily tend to have more heart
disease. That is the conclusion of a study that followed a
random sample of 12,986 people from three locations for
about four years. All subjects were free of heart disease at
the beginning of the study. The subjects took the
Spielberger Trait Anger Scale test, which measures how
prone a person is to sudden anger. Displayed are data for
the 8474 people in the sample who had normal blood
pressure. CHD stands for "coronary heart disease," which
includes people who had heart attacks and those who
needed medical treatment for heart disease.
CHD
No C
HD
Total
Low an
ger
53
3057
3110
Moderate
anger
110
4621
4731
High a
nger
27
Tota
1
633
190
606 8284
8474
O Macmillan Learning
SOLVE: Give the value of the chi-square test statistic. Give
your answer to at least two decimal places.
x² =
SOLVE: Give the number of degrees of freedom.
df =
Expert Solution
This question has been solved!
Explore an expertly crafted, step-by-step solution for a thorough understanding of key concepts.

This is a popular solution

Trending nowThis is a popular solution!

Step by stepSolved in 3 steps with 3 images

Knowledge Booster

Similar questions
- 2. Metal Tags on Penguins and Survival. Data were collected over a 10-year timespan from a sample of 100 penguins that were randomly given either metal or electronic tags. One variable examined is the survival rate 10 years after tagging. The scientists observed that 10 of the 50 metal tagged penguins survived, compared to 18 of the 50 electronic tagged penguins. Test whether the survival rate is lower among metal- tagged penguins than among electronic-tagged penguins. Use subscripts E for Electronic and M for Metal. a. State hypotheses. b. Calculate the sample statistic PE - PM c. Use Normal distribution methods to calculate a z-test statistic, given SE = 0.0898. d. Find the p-value and draw a Normal curve with z-statistic and appropriate shaded region. Normal curve: p-value: e. State the conclusion of the test in context, using nontechnical language. f. Find a 90% confidence interval to three decimal places for this difference in proportions, given SE= 0.08836. Show your…arrow_forwardA group of disabled women ages 65 and older were followed for several years. It was found that those who had a vitamin B12 deficiency were twice as likely to suffer from severe depressions than those who did not.a. Describe the type of study being performed.b. Describe the explanatory variable(s) and response variable(s).arrow_forwardPLEASE ANSWER ASAP: A case-control study was conducted to evaluate the relationship between physical activity and coronary heart disease (CHD) in men. A total of 406 men newly diagnosed with CHD were included together with 406 men of similar ages who did not have CHD. The risk of CHD (measured by the OR) was higher among men who were inactive or only moderately active (collectively called ‘inactive’) than among those who were physically active: (See attached image) Odds ratio for inactive men compared to active men= (299 x 136)/(270 x 107)=1.41Suppose there is no misclassification in these data.What would the observed OR have been... 1. If 20% of all the inactive men had been misclassified as active? 2. If 10 % of inactive cases had been misclassified as active?arrow_forward
- A clinical psychologist is investigating the relationship between sleep and feelings ofanxiety. For a sample of 15 individuals, he asks each participant to indicate how many hours theytypically sleep each night and each participant also completes an anxiety assessment. The followingdata is obtained:Hours of sleep: M=6.0 SS=16.0Anxiety scores: M=8.0 SS=64.0SP = - 20.0 a. Compute the correlation between hours of sleep and anxiety scores.arrow_forwardA sample of 250 employees of a company is selected, and the average age is found to be 35 years. This value is a statistic or parameter.arrow_forwardA researcher gathered a sample of participants who volunteered for a studying of phobias. She measured anxiety level of participants as they viewed photos of spiders and again when they viewed puppies. Which statistical test is appropriate for this study and why?arrow_forward
- A researcher wants to find the effect of a special diet on systolic blood pressure. A sample of 7 adults was selected to start them on this diet for 3 months. Based on this information, can it be stated that systolic blood pressure changes with the special diet? The test statistic that will determine whether systolic blood pressure changes with the special diet is...... A. 1.23 B. 0.48 C. 18.1 D. 21.08 E. 4.08arrow_forwardPart 1 of 4 A doctor in Oklahoma City wants to know whether the average life span for heart disease patients at four hospitals in the city differ. The data below represents the life span, in years, of heart disease patients from each hospital. Perform an ANOVA test with a 10% level of significance to test whether the average life span of heart disease patients in Oklahoma City differs depending on the hospital that treats them Life Span of Patients Treated at Hospital 1: 8.1, 1.2, 7, 11.5, 21, 2, 15.3, 19.2, 10.5, 15.4, 12.7, 15.3, 12.1, 7.5, 11.4, 16.4, 26.7, 14.6, 1.5, 16.3, 12.6, 0.8, 18.2, 4.2, 9.6, 21, 16.3, 2.7 Life Span of Patients Treated at Hospital 2: 17.6, 11.6, 16.8, 5.2, 6.7, 3.2, 13.8, 12.5, 0.9, 6, 14.3, 1.8, 14.8, 10, 5.8, 15.2, 10, 3.7, 11.4, 21.6, 12.9, 0.5, 9.2, 13.9, 10.9 Life Span of Patients Treated at Hospital 3: 8.5, 2.3, 11, 7.4, 14.8, 5.8, 11, 3.4, 10.9, 1.1, 5.9, 21.6, 12.5, 0.1, 15.5, 15.4, 0.8, 7.7, 5.6, 12, 7.1 Life Span of Patients Treated at Hospital 4:…arrow_forwardIn an observational study it was found that people who had received the flu shot this year had better blood pressure readings, on average, than people who did not. Can it be claimed that the flu shot is the cause of the lower overall blood pressure? Why or why not?arrow_forward
- A statistics content developer at Aplia wanted to know whether study skills are related to memory quality. She invited student volunteers to perform an online memory task. The students saw a list of 60 words and were then asked to recognize a list of 10 words that were on the original list. Students were also asked to provide their GPAs. Consider the following data set, which was collected from student volunteers in 2009. The table gives the frequency for five intervals of scores on the number of correctly identified words. Use the dropdown menus to complete the table by filling in the missing values for the proportions and percentages. Score Interval f Proportion Percentage 9–10 29 0.19 19% 7–8 53 5–6 50 3–4 22 0.14 14% 1–2 1 0.01 1%arrow_forwardDenny studied factors affecting cardiovascular reactivity to a postural change in a sample of healthy men and women. Change in systolic blood pressure (SBP) from supine to standing position was used as the measure of cardiac reactivity in a sample of 842 adults. Supine measurement of blood pressure was taken after participants had lain on an examination table for 15 minutes. Blood pressure was determined every 30 seconds using a Dinamap device for 2 minutes, and the measurements were averaged. Participants then stood up immediately, and additional measurements were made for another 2 minutes. Below is a table describing the characteristics of Denny’s sample: Which measures of dispersion, if any, are presented in this table (Ranges, SDs)? If age is normally distributed, approximately what percent of the sample would be younger than 50? If BMI is normally distributed, approximately what percent of the sample would have a BMI higher than 33.1?arrow_forward
arrow_back_ios
arrow_forward_ios
Recommended textbooks for you
- MATLAB: An Introduction with ApplicationsStatisticsISBN:9781119256830Author:Amos GilatPublisher:John Wiley & Sons Inc
 Probability and Statistics for Engineering and th...StatisticsISBN:9781305251809Author:Jay L. DevorePublisher:Cengage Learning
 Statistics for The Behavioral Sciences (MindTap C...StatisticsISBN:9781305504912Author:Frederick J Gravetter, Larry B. WallnauPublisher:Cengage Learning
  Elementary Statistics: Picturing the World (7th E...StatisticsISBN:9780134683416Author:Ron Larson, Betsy FarberPublisher:PEARSON
 The Basic Practice of StatisticsStatisticsISBN:9781319042578Author:David S. Moore, William I. Notz, Michael A. FlignerPublisher:W. H. Freeman
 Introduction to the Practice of StatisticsStatisticsISBN:9781319013387Author:David S. Moore, George P. McCabe, Bruce A. CraigPublisher:W. H. Freeman
MATLAB: An Introduction with Applications
Statistics
ISBN:9781119256830
Author:Amos Gilat
Publisher:John Wiley & Sons Inc
Probability and Statistics for Engineering and th...
Statistics
ISBN:9781305251809
Author:Jay L. Devore
Publisher:Cengage Learning
Statistics for The Behavioral Sciences (MindTap C...
Statistics
ISBN:9781305504912
Author:Frederick J Gravetter, Larry B. Wallnau
Publisher:Cengage Learning
Elementary Statistics: Picturing the World (7th E...
Statistics
ISBN:9780134683416
Author:Ron Larson, Betsy Farber
Publisher:PEARSON
The Basic Practice of Statistics
Statistics
ISBN:9781319042578
Author:David S. Moore, William I. Notz, Michael A. Fligner
Publisher:W. H. Freeman
Introduction to the Practice of Statistics
Statistics
ISBN:9781319013387
Author:David S. Moore, George P. McCabe, Bruce A. Craig
Publisher:W. H. Freeman