
MATLAB: An Introduction with Applications
6th Edition
ISBN: 9781119256830
Author: Amos Gilat
Publisher: John Wiley & Sons Inc
expand_more
expand_more
format_list_bulleted
Related questions
Question
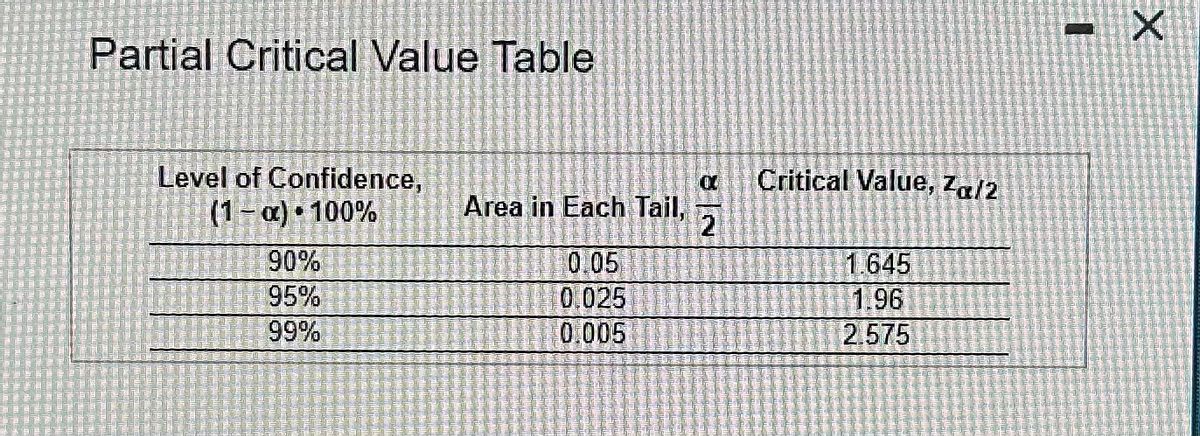

Transcribed Image Text:Partial Critical Value Table
Level of Confidence,
(1-α) 100%
90%
95%
99%
Area in Each Tail,
0.05
0.025
0.005
XX Critical Value, Zα/2
2
1.645
1.96
2.575
X

Transcribed Image Text:People were polled on how many books they read the previous year. Initial survey results indicate that s= 18.3 books. Complete parts (a) through (d) below.
Click the icon to view a partial table of critical values
(a) How many subjects are needed to estimate the mean number of books read the previous year within six books with 95% confidence?
This 95% confidence level requires subjects. (Round up to the nearest subject)
Expert Solution
This question has been solved!
Explore an expertly crafted, step-by-step solution for a thorough understanding of key concepts.

Step by stepSolved in 3 steps

Knowledge Booster

Similar questions
- Need crit value, the pictured question b, and rejection region.arrow_forwardWomen stereotypically talk more than men do and researchers wondered how much more. Suppose a study attempted to determine the difference in the mean number of words spoken by men or women per day. The results of the study are summarized in the table. Group Populationmean Samplesize Samplemean Sample standarddeviation Standard errorestimate women ?w (unknown) ?w= 36 ?⎯⎯⎯w= 14704 ?w=6215 SEw=1036 men ?m (unknown) ?m= 24 ?⎯⎯⎯m= 15022 ?m=7864 SEm=1605 df=41.4224 Assume the conditions are satisfied for a two‑sample ?‑confidence interval. First, determine the positive critical value, ?, for a 95% confidence interval to estimate how many more words women speak each day on average compared to men, ?w−?m. Give your answer precise to at least three decimal places. Determine lower and upper limits of a 95% confidence interval for how many more words speak each day on average compared to men. A negative number would indicate how many fewer words women speak each day on average…arrow_forwardA violin student records the number of hours they spend practicing during each of ten consecutive weeks. 2.5 3.5 3 2.4 What is the first quartile for this data? 3.6 7 8.1 5.4 7 4.1 8.6arrow_forward
- otected View - Saved to this PC Search View Help 12. The city council is considering a law that would ban smoking in all public facilities. A sample has been selected from the community and tested for of the ordinance. Is there a statistically significant relationship between age and support for the anti-smoking law? Use the five step model as a guide and write a sentence or two interpreting your results. support Age More than 40 Less than 40 Support: For 145 78 223 Against 103 248 169 247 272 495 A. Use probabilities to determine if these two variable are independent or dependent P (Less than 40) 3D P(Less than 40 | For)= P(Less than 40| Against) = Are age and support for the anti-smoking law independent? (Yes independent/No = not independent) B. Conduct a hypothesis test using an alpha of .05 that these variables are iarrow_forwardChoose the appropriate statistical test. When computing, be sure to round each answer as indicated. A dentist wonders if depression affects ratings of tooth pain. In the general population, using a scale of 1-10 with higher values indicating more pain, the average pain rating for patients with toothaches is 6.8. A sample of 30 patients that show high levels of depression have an average pain rating of 7.1 (variance 0.8). What should the dentist determine? 1. Calculate the estimated standard error. (round to 3 decimals). [st.error] 2. What is thet-obtained? (round to 3 decimals). 3. What is the t-cv? (exact value) 4. What is your conclusion? Only type "Reject" or Retain"arrow_forwardA survey was conducted that asked 1013 people how many books they had read in the past year. Results indicated that x=10.3 books and s=16.6books. Construct a 90% confidence interval for the mean number of books people read. Interpret the interval. Construct a 90% confidence interval for the mean number of books people read and interpret the result. Select the correct choice below and fill in the answer boxes to complete your choice. (Use ascending order. Round to two decimal places as needed.) A. There is a 90% probability that the true mean number of books read is between ___ and ____ B. There is 90% confidence that the population mean number of books read is between ___ and ____. C. If repeated samples are taken, 90% of them will have a sample mean between ___ and ___.arrow_forward
- People were polled on how many books they read the previous year. Initial survey results indicate that s = 11.9 books. Complete parts (a) through (d) below. A Click the icon to view a partial table of critical values. (a) How many subjects are needed to estimate the mean number of books read the previous year within six books with 95% confidence? This 95% confidence level requires subjects. (Round up to the nearest subject.) (b) How many subjects are needed to estimate the mean number of books read the previous year within three books with 95% confidence? This 95% confidence level requires subjects. (Round up to the nearest subject.) (c) What effect does doubling the required accuracy have on the sample size? O A. Doubling the required accuracy nearly halves the sample size. O B. Doubling the required accuracy nearly doubles the sample size. O C. Doubling the required accuracy nearly quarters the sample size. O D. Doubling the required accuracy nearly quadruples the sample size. (d)…arrow_forwardResearchers studied the mean egg length (in millimeters) for a bird population. After taking a random sample of eggs, they obtained a 95% confidence interval of (45,60). What is the value of the margin of error? Choose the correct answer below. A. 15 mm B. 52.5 mm O c. 7.5 mm O D. 1.96arrow_forwardYou are a researcher studying the antler size of male Alaskan Moose in a certain Alaska location. You gather a random sample of 18 male moose and record the width (in feet) of the antlers. The data is displayed in the table below. Estimate the mean antler width of all Alaskan male moose in this area. Use a 90% confidence level. 3.6 5.6 3.4 3.4 4 5.2 4.6 4.3 4.6 4.6 2.2 6.4 3.6 3.1 5.4 4.4 3.3 4.3 a) Find the confidence interval: < μμ < b) What is the margin of error of your interval? c) Interpret your 90% confidence interval in context.arrow_forward
- A survey was conducted that asked 1016 people how many books they had read in the past year. Results indicated that x = 11.8 books and s = 16.6 books. Construct a 99% confidence interval for the mean number of books people read. Interpret the interval. E Click the icon to view the table of critical t-values. Construct a 99% confidence interval for the mean number of books people read and interpret the result. Select the correct choice below and fill in the answer boxes to complete vour choice. (Use ascending order. Round to two decimal places as needed.) O A. If repeated samples are taken, 99% of them will have a sample mean between and. Table of Critical t-Values O B. There is a 99% probability that the true mean number of books read is between and. OC. There is 99% confidence that the population mean number of books read is between and . t-Distribution Area in Right Tail Degrees of Freedom 0.25 0.20 0.15 0.10 0025 00 0.01 0.005 0.0025 0.001 0.0005 1.376 1.963 1.061 1.386 0.978 1.250…arrow_forwardA survey was conducted that asked 963 people how many books they had read in the past year. Results indicated that x=14.7 books and s=17.8 books. Construct a 90% confidence interval for the mean number of books people read. Interpret the interval.Construct a 90% confidence interval for the mean number of books people read and interpret the result. Select the correct choice below and fill in the answer boxes to complete your choice.(Use ascending order. Round to two decimal places as needed.)A. If repeated samples are taken, 90% of them will have a sample mean between ___ and ____ B. There is a 90% probability that the true mean number of books read is between ____ and ___ C. There is a 90% confidence that the population mean number of books read is between ___ and ___arrow_forward
arrow_back_ios
arrow_forward_ios
Recommended textbooks for you
- MATLAB: An Introduction with ApplicationsStatisticsISBN:9781119256830Author:Amos GilatPublisher:John Wiley & Sons Inc
 Probability and Statistics for Engineering and th...StatisticsISBN:9781305251809Author:Jay L. DevorePublisher:Cengage Learning
 Statistics for The Behavioral Sciences (MindTap C...StatisticsISBN:9781305504912Author:Frederick J Gravetter, Larry B. WallnauPublisher:Cengage Learning
  Elementary Statistics: Picturing the World (7th E...StatisticsISBN:9780134683416Author:Ron Larson, Betsy FarberPublisher:PEARSON
 The Basic Practice of StatisticsStatisticsISBN:9781319042578Author:David S. Moore, William I. Notz, Michael A. FlignerPublisher:W. H. Freeman
 Introduction to the Practice of StatisticsStatisticsISBN:9781319013387Author:David S. Moore, George P. McCabe, Bruce A. CraigPublisher:W. H. Freeman
MATLAB: An Introduction with Applications
Statistics
ISBN:9781119256830
Author:Amos Gilat
Publisher:John Wiley & Sons Inc
Probability and Statistics for Engineering and th...
Statistics
ISBN:9781305251809
Author:Jay L. Devore
Publisher:Cengage Learning
Statistics for The Behavioral Sciences (MindTap C...
Statistics
ISBN:9781305504912
Author:Frederick J Gravetter, Larry B. Wallnau
Publisher:Cengage Learning
Elementary Statistics: Picturing the World (7th E...
Statistics
ISBN:9780134683416
Author:Ron Larson, Betsy Farber
Publisher:PEARSON
The Basic Practice of Statistics
Statistics
ISBN:9781319042578
Author:David S. Moore, William I. Notz, Michael A. Fligner
Publisher:W. H. Freeman
Introduction to the Practice of Statistics
Statistics
ISBN:9781319013387
Author:David S. Moore, George P. McCabe, Bruce A. Craig
Publisher:W. H. Freeman