
MATLAB: An Introduction with Applications
6th Edition
ISBN: 9781119256830
Author: Amos Gilat
Publisher: John Wiley & Sons Inc
expand_more
expand_more
format_list_bulleted
Related questions
Question
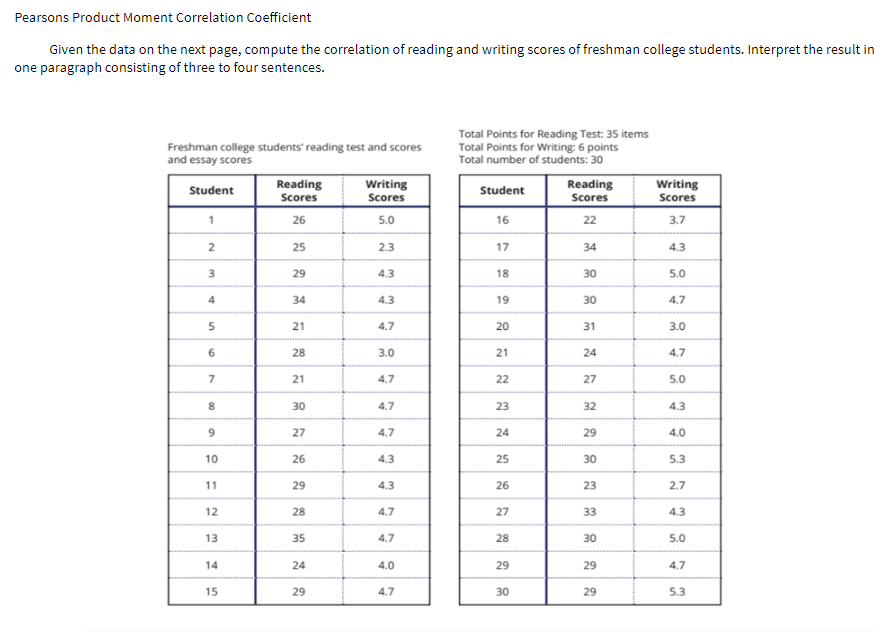

Transcribed Image Text:Pearsons Product Moment Correlation Coefficient
Given the data on the next page, compute the correlation of reading and writing scores of freshman college students. Interpret the result in
one paragraph consisting of three to four sentences.
Freshman college students' reading test and scores
and essay scores
Student
1
2
3
4
5
6
7
00
8
9
10
11
12
13
14
15
Reading
Scores
26
25
29
34
21
28
21
30
27
26
29
28
35
24
29
Writing
Scores
5.0
2.3
4.3
4.3
4.7
3.0
4.7
4.7
4.7
4.3
4.3
4.7
4.7
4.0
4.7
Total Points for Reading Test: 35 items
Total Points for Writing: 6 points
Total number of students: 30
Student
16
17
18
19
20
21
22
23
24
25
26
27
28
29
30
Reading
Scores
22
34
30
30
31
24
27
32
29
30
23
33
30
29
29
Writing
Scores
3.7
4.3
5.0
4.7
3.0
4.7
5.0
4.3
4.0
5.3
2.7
4.3
5.0
4.7
5.3
Expert Solution
This question has been solved!
Explore an expertly crafted, step-by-step solution for a thorough understanding of key concepts.

Step by stepSolved in 3 steps

Knowledge Booster

Similar questions
- A correlation of 0.5. The community of having a cat and dog average is 60% and SD = 15. find the score of people having cats that show 75%.arrow_forwardThe correlation between midterm and final grades for 300 students is 0.620. If 5 points are added to each midterm grade, the new r will be: a. 0.124 b. 0.57 c. 0.62 d. 0.744arrow_forwardWhat is the coefficient of correlation given this data: X = 61, 62, 95, 71, 49 Y = 32, 47, 107, 77, 41 Please format to 2 decimal places.arrow_forward
- The more serving of fruits and vegetables that people tend to eat during the week, the lower their levels of cholesterol. What type of correlation vegetables eaten and cholesterol levels? A positive B negativearrow_forwardFill in the blank. A A Jhy trial exists between two variables when the values of one variable are somehow associated with the values of the other variable. exists between two variables when the values of one variable are somehow associated with the values of the other variable. correlation inference differencearrow_forwardhow do you construct a frequency histogram?arrow_forward
arrow_back_ios
arrow_forward_ios
Recommended textbooks for you
- MATLAB: An Introduction with ApplicationsStatisticsISBN:9781119256830Author:Amos GilatPublisher:John Wiley & Sons Inc
 Probability and Statistics for Engineering and th...StatisticsISBN:9781305251809Author:Jay L. DevorePublisher:Cengage Learning
 Statistics for The Behavioral Sciences (MindTap C...StatisticsISBN:9781305504912Author:Frederick J Gravetter, Larry B. WallnauPublisher:Cengage Learning
  Elementary Statistics: Picturing the World (7th E...StatisticsISBN:9780134683416Author:Ron Larson, Betsy FarberPublisher:PEARSON
 The Basic Practice of StatisticsStatisticsISBN:9781319042578Author:David S. Moore, William I. Notz, Michael A. FlignerPublisher:W. H. Freeman
 Introduction to the Practice of StatisticsStatisticsISBN:9781319013387Author:David S. Moore, George P. McCabe, Bruce A. CraigPublisher:W. H. Freeman
MATLAB: An Introduction with Applications
Statistics
ISBN:9781119256830
Author:Amos Gilat
Publisher:John Wiley & Sons Inc
Probability and Statistics for Engineering and th...
Statistics
ISBN:9781305251809
Author:Jay L. Devore
Publisher:Cengage Learning
Statistics for The Behavioral Sciences (MindTap C...
Statistics
ISBN:9781305504912
Author:Frederick J Gravetter, Larry B. Wallnau
Publisher:Cengage Learning
Elementary Statistics: Picturing the World (7th E...
Statistics
ISBN:9780134683416
Author:Ron Larson, Betsy Farber
Publisher:PEARSON
The Basic Practice of Statistics
Statistics
ISBN:9781319042578
Author:David S. Moore, William I. Notz, Michael A. Fligner
Publisher:W. H. Freeman
Introduction to the Practice of Statistics
Statistics
ISBN:9781319013387
Author:David S. Moore, George P. McCabe, Bruce A. Craig
Publisher:W. H. Freeman