
MATLAB: An Introduction with Applications
6th Edition
ISBN: 9781119256830
Author: Amos Gilat
Publisher: John Wiley & Sons Inc
expand_more
expand_more
format_list_bulleted
Related questions
Question
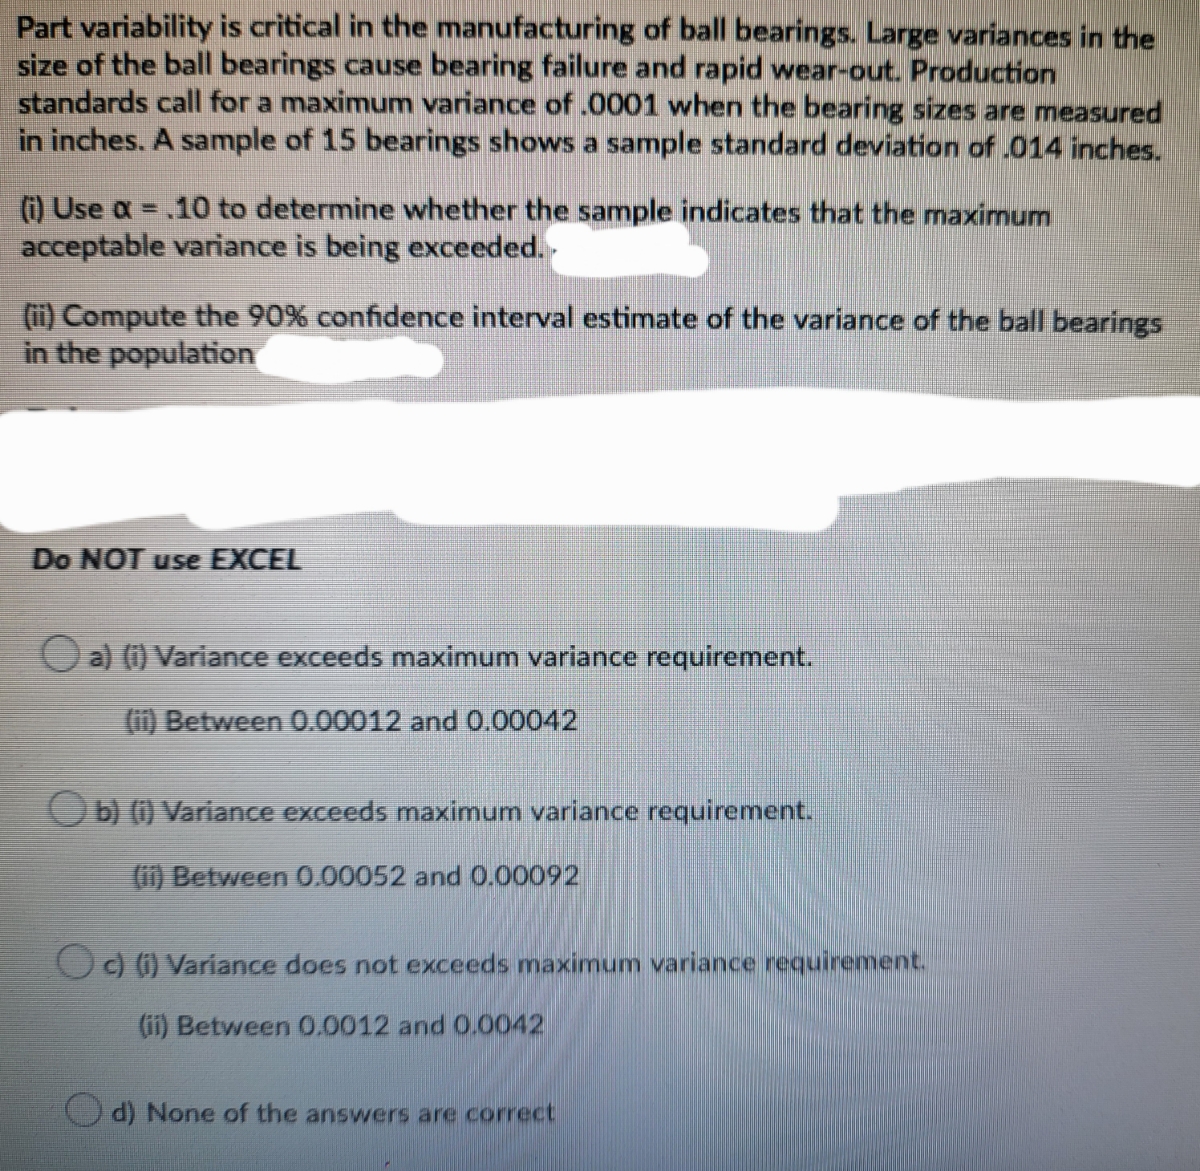

Transcribed Image Text:Part variability is critical in the manufacturing of ball bearings. Large variances in the
size of the ball bearings cause bearing failure and rapid wear-out. Production
standards call for a maximum variance of .0001 when the bearing sizes are measured
in inches. A sample of 15 bearings shows a sample standard deviation of .014 inches.
10 to determine whether the sample indicates that the maximum
(1) Use a =
acceptable variance is being exceeded.
(ii) Compute the 90% confidence interval estimate of the variance of the ball bearings
in the population
Do NOT use EXCEL
O a) (1) Variance exceeds maximum variance requirement.
(ii) Between 0.00012 and 0.00042
Ob) 1) Variance exceeds maximum variance requirement.
() Between O.00052 and 0.00092
O Variance does not exceeds maximum variance requirement.
(1i) Between 0.0012 and 0.0042
d) None of the answers are correct
Expert Solution
This question has been solved!
Explore an expertly crafted, step-by-step solution for a thorough understanding of key concepts.

This is a popular solution

Trending nowThis is a popular solution!

Step by stepSolved in 3 steps

Knowledge Booster

Similar questions
- The mean pulse rate for adult males is approximately 61.4 beats per minute. In a sample of 27 overweight males, the mean pulse rate was 62.1 beats per minute with a standard deviation of 4.19 beats per minute. Test at a = 0.10 whether these findings suggest that the mean pulse rate for all such overweight males is significantly greater than 61.4. You obtain a sample of size 27 with a mean of 62.1 and a standard deviation of 4.19. You believe that the population is normally distributed. (a). The null and alternative hypotheses are O Ho: ữ = 62.1 Ha:ữ > 62.1 Ho:µ = 61.4 Ha: µ > 61.4 Ο H0: μ = 61.4 На:р 62.1 Part 2 of 4 (b). The test statistic is (use 4 decimal places)arrow_forwardA random sample of 90 eighth grade students' scores on a national mathematics assessment test has a mean score of 288. This test result prompts a state school administrator to declare that the mean score for the state's eighth graders on this exam is more than 280. Assume that the population standard deviation is 36. At α = 0.08, is there enough evidence to support the administrator's claim? Complete parts (a) through (e). (a) Write the claim mathematically and identify Ho and H₂. Choose the correct answer below. A. Ho: μ = 280 (claim) Ha:μ>280 Ho:μ≤280 Ha: μ> 280 (claim) B. Ho: μ = 280 P-value = (b) Find the standardized test statistic z. z = 2.11 (Round to two decimal places as needed.) (c) Find the P-value. E. Ho: μ≤280 (claim) Ha:μ>280 Ha: μ> 280 (claim) (Round to three decimal places as needed.) C. Ho: μ ≥280 (claim) Ha:μ< 280 F. Ho: μ< 280 H₂:μ ≥280 (claim)arrow_forwardTo compare the dry braking distances from 30 to 0 miles per hour for two makes of automobiles, a safety engineer conducts braking tests for 35 models of Make A and 35 models of Make B. The mean braking distance for Make A is 43 feet. Assume the population standard deviation is 4.6 feet. The mean braking distance for Make B is 46 feet. Assume the population standard deviation is 4.5 feet. At α=0.10, can the engineer support the claim that the mean braking distances are different for the two makes of automobiles? Assume the samples are random and independent, and the populations are normally distributed. The critical value(s) is/are Find the standardized test statistic z for μ1−μ2.arrow_forward
- A random sample of 82 eighth grade students' scores on a national mathematics assessment test has a mean score of 286. This test result prompts a state school administrator to declare that the mean score for the state's eighth graders on this exam is more than 280. Assume that the population standard deviation is 38. At α = 0.05, is there enough evidence to support the administrator's claim? Complete parts (a) through (e). (a) Write the claim mathematically and identify Ho and H₂. Choose the correct answer below. O A. Ho: ≤280 (claim) H₂:μ>280 O D. Ho: μ≤280 Ha: μ> 280 (claim) B. Ho: μ280 OF. Ho: μ = 280 H₂: µ>280 (claim)arrow_forwardA population has parameters u = 189.5 and o = 61.9. You intend to draw a random sample of size n = 113. What is the mean of the distribution of sample means? What is the standard deviation of the distribution of sample means? (Report answer accurate to 2 decimal places.)arrow_forwardBabies: A sample of 25 one-year-old girls had a mean weight of 24.1 pounds with a standard deviation of 4.3 pounds. Assume that the population of weights is normally distributed. A pediatrician claims that the standard deviation of the weights of one-year-old girls is greater than 7 pounds. Do the data provide convincing evidence that the pediatrician's claim is true? Use the =α0.05 level of significance.arrow_forward
- Part Variability is critical in the manufacturing of the ball bearings. Large variances in the size of the ball bearings cause bearing failure and rapid wear out. Production standards call for a maximum variance of .0001 when the bearing sizes are measured in inches. A sample of 15 bearings shows a sample standard deviation of .014. a. Compute the 90% confidence interval estimate of the variance of the ball bearings in the population. b. Use a= 0.10 to determine whether the sample indicates that the maximum acceptable variance is being exceeded. Use critical value approach. ( Note: You must state null and alternative hypotheses, compute the test statistic, Report the critical Value, and draw a conclusion.arrow_forwardA random sample of 82 eighth grade students' scores on a national mathematics assessment test has a mean score of 286. This test result prompts a state school administrator to declare that the mean score for the state's eighth graders on this exam is more than 280. Assume that the population standard deviation is 38. At α = 0.05, is there enough evidence to support the administrator's claim? Complete parts (a) through (e). (a) Write the claim mathematically and identify Ho and H₂. Choose the correct answer below. O A. Ho: μ≤280 (claim) H₂:μ>280 O D. Ho: μ≤280 Ha: μ> 280 (claim) O B. Ho: μ280 OF. Ho: μ = 280 Ha: μ>280 (claim)arrow_forwardIQ scores among the general population have a mean of 100 and a standard deviation of 14. A researcher claims that the standard deviation, o, of IQ scores for females is not equal to 14. A random sample of 24 IQ scores females had a mean of 98 and a standard deviation of 11. Assuming that IQ scores for females are approximately normally distributed, is there significant evidence (at the 0.05 level of significance) to conclude that the researcher's claim is correct? Perform a two-tailed test. Then complete the parts below. Carry your intermediate computations to three or more decimal places and round your answers as specified below. (If necessary, consult a list of formulas.) (a) State the null hypothesis H, and the alternative hypothesis H,. H, :0 H, :0 (b) Determine the type of test statistic to use. (Choose one) ▼ O=0 OSO (c) Find the value of the test statistic. (Round to three or more decimal places.) Oarrow_forwardColonial Funds claims to have a bond fund that has maintained a mean share price of $10.00. They claim that the variance of the share price is 0.18. To test this claim, the investor randomly selects 29 days during the last year. He finds an average share price of $9.80 with a standard deviation of 0.4006. Can the investor conclude that the share price of the bond fund varies from Colonial Funds claims at α=0.05? Step 1 of 5 : State of the hypotheses in terms of the standard deviation. Round the standard deviation to four decimal places when necessary Step 2 of 5 : Determine the critical value(s) of the test statistic. If the test is two-tailed, separate the values with a comma. Round your answer to three decimal places. Step 3 of 5 : Determine the value of the test statistic. Round your answer to three decimal places. Step 4 of 5 : Make the decision. Step 5 of 5 : What is the conclusion?arrow_forward5. The standard deviation of a sample of the costs of 15 automobile repairs at a local garage was $120.82. Assuming that the variable is normally distributed, find the critical values, Xleft and right, that could be used to determine the 90% confidence interval of the true variance and standard deviation.arrow_forwardarrow_back_iosarrow_forward_ios
Recommended textbooks for you
- MATLAB: An Introduction with ApplicationsStatisticsISBN:9781119256830Author:Amos GilatPublisher:John Wiley & Sons Inc
 Probability and Statistics for Engineering and th...StatisticsISBN:9781305251809Author:Jay L. DevorePublisher:Cengage Learning
 Statistics for The Behavioral Sciences (MindTap C...StatisticsISBN:9781305504912Author:Frederick J Gravetter, Larry B. WallnauPublisher:Cengage Learning
  Elementary Statistics: Picturing the World (7th E...StatisticsISBN:9780134683416Author:Ron Larson, Betsy FarberPublisher:PEARSON
 The Basic Practice of StatisticsStatisticsISBN:9781319042578Author:David S. Moore, William I. Notz, Michael A. FlignerPublisher:W. H. Freeman
 Introduction to the Practice of StatisticsStatisticsISBN:9781319013387Author:David S. Moore, George P. McCabe, Bruce A. CraigPublisher:W. H. Freeman
MATLAB: An Introduction with Applications
Statistics
ISBN:9781119256830
Author:Amos Gilat
Publisher:John Wiley & Sons Inc
Probability and Statistics for Engineering and th...
Statistics
ISBN:9781305251809
Author:Jay L. Devore
Publisher:Cengage Learning
Statistics for The Behavioral Sciences (MindTap C...
Statistics
ISBN:9781305504912
Author:Frederick J Gravetter, Larry B. Wallnau
Publisher:Cengage Learning
Elementary Statistics: Picturing the World (7th E...
Statistics
ISBN:9780134683416
Author:Ron Larson, Betsy Farber
Publisher:PEARSON
The Basic Practice of Statistics
Statistics
ISBN:9781319042578
Author:David S. Moore, William I. Notz, Michael A. Fligner
Publisher:W. H. Freeman
Introduction to the Practice of Statistics
Statistics
ISBN:9781319013387
Author:David S. Moore, George P. McCabe, Bruce A. Craig
Publisher:W. H. Freeman