Practical Management Science
6th Edition
ISBN: 9781337406659
Author: WINSTON, Wayne L.
Publisher: Cengage,
Bartleby Related Questions Icon

Related questions

Question

COMPARISION AMONG DIFFERENT QUEUING SYSTEMS.

I NEED HELP WITH PART G,H,I,J &K. 
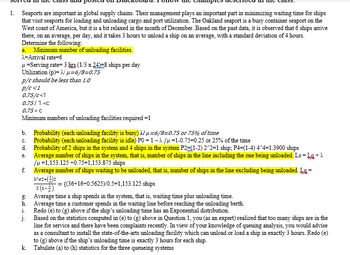
1. Seaports are important in global supply chains. Their management plays an important part in minimizing waiting time for ships
that visit seaports for loading and unloading cargo and port utilization. The Oakland seaport is a busy container seaport on the
West coast of America, but it is a bit relaxed in the month of December. Based on the past data, it is observed that 6 ships arrive
there, on an average, per day, and it takes 3 hours to unload a ship on an average, with a standard deviation of 4 hours.
Determine the following:
a. Minimum number of unloading facilities.
λ=Arrival rate=6
μ = Serving rate=3 hrs (1/3 x 24)-8 ships per day
Utilization (p)=
μ-6/8=0.75
p/c should be less than 1.0
p/c<1
0.75/c<1
0.75/1 <c
0.75<C
Minimum numbers of unloading facilities required =1
b. Probability (each unloading facility is busy)
μ-6/8-0.75 or 75% of time
Probability (each unloading facility is idle) P0=1-λ/μ-1-0.75-0.25 or 25% of the time
C.
d. Probability of 2 ships in the system and 4 ships in the system P2=(1-2) 2^2=1 ship; P4=(1-4) 4^4=1.3900 ships
e.
Average number of ships in the system, that is, number of ships in the line including the one being unloaded. Ls = Lg + A
/u=1,153.125 +0.75=1,153.875 ships
Average number of ships waiting to be unloaded, that is, number of ships in the line excluding being unloaded. La=
λέσ2+(3) 2
= {(36+16+0.5625)/0.5-1,153.125 ships
2 (1-4)
f.
g.
h.
1.
j.
Average time a ship spends in the system, that is, waiting time plus unloading time.
Average time a customer spends in the waiting line before reaching the unloading berth.
Redo (e) to (g) above if the ship's unloading time has an Exponential distribution.
Based on the statistics computed in (e) to (g) above in Question 1, you (as an expert) realized that too many ships are in the
line for service and there have been complaints recently. In view of your knowledge of queuing analysis, you would advise
as a consultant to install the state-of-the-arts unloading facility which can unload or load a ship in exactly 3 hours. Redo (e)
to (g) above if the ship's unloading time is exactly 3 hours for each ship.
Tabulate (a) to (h) statistics for the three queueing systems
k.
expand button
Transcribed Image Text:1. Seaports are important in global supply chains. Their management plays an important part in minimizing waiting time for ships that visit seaports for loading and unloading cargo and port utilization. The Oakland seaport is a busy container seaport on the West coast of America, but it is a bit relaxed in the month of December. Based on the past data, it is observed that 6 ships arrive there, on an average, per day, and it takes 3 hours to unload a ship on an average, with a standard deviation of 4 hours. Determine the following: a. Minimum number of unloading facilities. λ=Arrival rate=6 μ = Serving rate=3 hrs (1/3 x 24)-8 ships per day Utilization (p)= μ-6/8=0.75 p/c should be less than 1.0 p/c<1 0.75/c<1 0.75/1 <c 0.75<C Minimum numbers of unloading facilities required =1 b. Probability (each unloading facility is busy) μ-6/8-0.75 or 75% of time Probability (each unloading facility is idle) P0=1-λ/μ-1-0.75-0.25 or 25% of the time C. d. Probability of 2 ships in the system and 4 ships in the system P2=(1-2) 2^2=1 ship; P4=(1-4) 4^4=1.3900 ships e. Average number of ships in the system, that is, number of ships in the line including the one being unloaded. Ls = Lg + A /u=1,153.125 +0.75=1,153.875 ships Average number of ships waiting to be unloaded, that is, number of ships in the line excluding being unloaded. La= λέσ2+(3) 2 = {(36+16+0.5625)/0.5-1,153.125 ships 2 (1-4) f. g. h. 1. j. Average time a ship spends in the system, that is, waiting time plus unloading time. Average time a customer spends in the waiting line before reaching the unloading berth. Redo (e) to (g) above if the ship's unloading time has an Exponential distribution. Based on the statistics computed in (e) to (g) above in Question 1, you (as an expert) realized that too many ships are in the line for service and there have been complaints recently. In view of your knowledge of queuing analysis, you would advise as a consultant to install the state-of-the-arts unloading facility which can unload or load a ship in exactly 3 hours. Redo (e) to (g) above if the ship's unloading time is exactly 3 hours for each ship. Tabulate (a) to (h) statistics for the three queueing systems k.
Expert Solution
Check Mark
Step 1: Queueing system

Queueing system analyzes the arrival pattern and service time in a system and optimizes the queue in terms of reduced waiting time in the queue as well as the system.

The given information is as follows.

Arrival rate λ = 6 Ships/day

Service rate μ13×24=8 ships/day

The standard deviation of service time σ = 4 hrs.

The calculations in part (d) are incorrect. Correct calculations are as follows.

Probability of 2 ships in the system = P0×λμn=0.25×682=0.25×0.752 = 0.1406

Probability of 4 ships in the system = P0×λμn=0.25×684=0.25×0.754 = 0.0791

Still need help?
Follow-up Questions
Read through expert solutions to related follow-up questions below.
Follow-up Question

Part e & f is incorrect

e.)Ls=3.125+0.75=3.875 ships

f.) Lq=(6^2(1/6)^2+0.75^2)/2(1-.75)=3.125 ships

g.)Ws=3.875/6=0.6458 days or 15.5 hours 

Solution
Bartleby Expert
by Bartleby Expert
SEE SOLUTION
Knowledge Booster
Background pattern image
Recommended textbooks for you
Text book image
Practical Management Science
Operations Management
ISBN:9781337406659
Author:WINSTON, Wayne L.
Publisher:Cengage,
Text book image
Operations Management
ISBN:9781259667473
Author:William J Stevenson
Publisher:McGraw-Hill Education
Text book image
Operations and Supply Chain Management (Mcgraw-hi...
Operations Management
ISBN:9781259666100
Author:F. Robert Jacobs, Richard B Chase
Publisher:McGraw-Hill Education
Text book image
Business in Action
Operations Management
ISBN:9780135198100
Author:BOVEE
Publisher:PEARSON CO
Text book image
Purchasing and Supply Chain Management
Operations Management
ISBN:9781285869681
Author:Robert M. Monczka, Robert B. Handfield, Larry C. Giunipero, James L. Patterson
Publisher:Cengage Learning
Text book image
Production and Operations Analysis, Seventh Editi...
Operations Management
ISBN:9781478623069
Author:Steven Nahmias, Tava Lennon Olsen
Publisher:Waveland Press, Inc.