Human Anatomy & Physiology (11th Edition)
11th Edition
ISBN: 9780134580999
Author: Elaine N. Marieb, Katja N. Hoehn
Publisher: PEARSON
expand_more
expand_more
format_list_bulleted
Concept explainers
Question

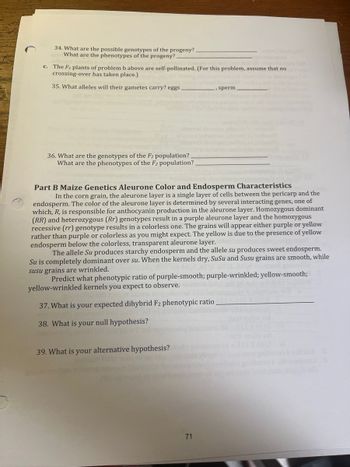
Transcribed Image Text:34. What are the possible genotypes of the progeny?.
What are the phenotypes of the progeny?.
c. The F1 plants of problem b above are self-pollinated. (For this problem, assume that no
crossing-over has taken place.)
35. What alleles will their gametes carry? eggs
36. What are the genotypes of the F2 population?.
What are the phenotypes of the F2 population?_
sperm
Part B Maize Genetics Aleurone Color and Endosperm Characteristics
In the corn grain, the aleurone layer is a single layer of cells between the pericarp and the
endosperm. The color of the aleurone layer is determined by several interacting genes, one of
which, R, is responsible for anthocyanin production in the aleurone layer. Homozygous dominant
(RR) and heterozygous (Rr) genotypes result in a purple aleurone layer and the homozygous
recessive (rr) genotype results in a colorless one. The grains will appear either purple or yellow
rather than purple or colorless as you might expect. The yellow is due to the presence of yellow
endosperm below the colorless, transparent aleurone layer.
The allele Su produces starchy endosperm and the allele su produces sweet endosperm.
Su is completely dominant over su. When the kernels dry, SuSu and Susu grains are smooth, while
susu grains are wrinkled.
Predict what phenotypic ratio of purple-smooth; purple-wrinkled; yellow-smooth;
yellow-wrinkled kernels you expect to observe.
37. What is your expected dihybrid F2 phenotypic ratio.
38. What is your null hypothesis?
I tol
39. What is your alternative hypothesis?
71

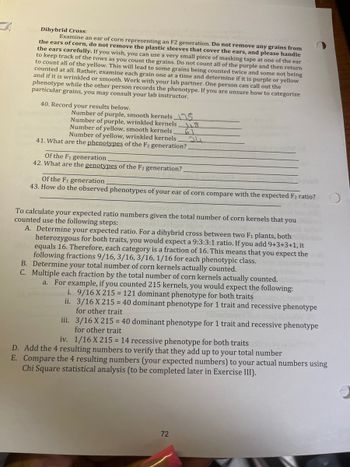
Transcribed Image Text:Dihybrid Cross:
Examine an ear of corn representing an F2 generation. Do not remove any grains from
the ears of corn, do not remove the plastic sleeves that cover the ears, and please handle
the ears carefully. If you wish, you can use a very small piece of masking tape at one of the ear
to keep track of the rows as you count the grains. Do not count all of the purple and then return
to count all of the yellow. This will lead to some grains being counted twice and some not being
counted at all. Rather, examine each grain one at a time and determine if it is purple or yellow
and if it is wrinkled or smooth. Work with your lab partner. One person can call out the
phenotype while the other person records the phenotype. If you are unsure how to categorize
particular grains, you may consult your lab instructor.
40. Record your results below.
Number of purple, smooth kernels 5
Number of purple, wrinkled kernels
Number of yellow, smooth kernels
Number of yellow, wrinkled kernels.
118
41. What are the phenotypes of the F2 generation?
Of the F1 generation.
42. What are the genotypes of the F2 generation?
Of the generation
43. How do the observed phenotypes of your ear of corn compare with the expected F2 ratio?
To calculate your expected ratio numbers given the total number of corn kernels that you
counted use the following steps:
A. Determine your expected ratio. For a dihybrid cross between two F₁ plants, both
heterozygous for both traits, you would expect a 9:3:3:1 ratio. If you add 9+3+3+1, it
equals 16. Therefore, each category is a fraction of 16. This means that you expect the 2
following fractions 9/16, 3/16, 3/16, 1/16 for each phenotypic class.
B. Determine your total number of corn kernels actually counted.
C. Multiple each fraction by the total number of corn kernels actually counted.
a. For example, if you counted 215 kernels, you would expect the following:
i. 9/16 X 215 = 121 dominant phenotype for both traits
ii. 3/16 X 215 = 40 dominant phenotype for 1 trait and recessive phenotype
for other trait
iii.
3/16 X 215 = 40 dominant phenotype for 1 trait and recessive phenotype
for other trait
iv. 1/16 X 215 = 14 recessive phenotype for both traits o
D. Add the 4 resulting numbers to verify that they add up to your total number
E. Compare the 4 resulting numbers (your expected numbers) to your actual numbers using
Chi Square statistical analysis (to be completed later in Exercise III).
72
Expert Solution
This question has been solved!
Explore an expertly crafted, step-by-step solution for a thorough understanding of key concepts.
This is a popular solution
Trending nowThis is a popular solution!
Step by stepSolved in 6 steps with 2 images

Knowledge Booster
Learn more about
Need a deep-dive on the concept behind this application? Look no further. Learn more about this topic, biology and related others by exploring similar questions and additional content below.Similar questions
- For a plant cell, on a blank sheet of paper, make 1 drawing of each of the phases of Meiosis I and II. Identify 2 key occurrences of each phase.arrow_forwardExtra Question Chapter 4 1. Consider the following cross concerning 4 different gene loci: AaBbCcDd (x) AabbCcdd From this cross, what is the probability of getting a progeny (offspring) with genotype AABbccdd? b. From this cross, what is the probability of getting a progeny (offspring) with genotype AabbCcDd? c. From this cross, what is the probability of getting a male progeny (offspring) with genotype aaBbCcdd? 2. Your neighbor has twelve children. One is blue eye color and short. Two are brown eye color and short. Two are blue eye color and tall. Seven look just like the parents; brown eye color with tall. What can you discover about the genetics of eye color and height of the children? a. How many traits are you dealing with? Each trait has phenotypes: Specify the phenotypes. b. What is the probability of the height of the children? What is the probability of the eye color of the children? (Refer to monohybrid punnett square slides 17-19) c. What are recessive traits based on the…arrow_forward42arrow_forward
- Gamete Production: in the following examples please list the possible gametes produced 1) In humans, sickle cell anemia is a disease caused by a mutation of a single gene that codes for an important protein. The allele for the normal protein is dominant (S) to the one that causes sickle cell anemia. a. What gametes would be produced by an individual who suffers from sickle cell anemia produce? b. What gamester would be produce by an individual that is a carrier of the sickle cell trait?arrow_forwardPlease answer last 3arrow_forwardPlease keep it short. Don't add a lot of information, thanks! - Explain why it is important that meiosis converts diploid cells to haploid. Then briefly explain how meiosis does that, makes a diploid cell haploid.arrow_forward
arrow_back_ios
arrow_forward_ios
Recommended textbooks for you
 Human Anatomy & Physiology (11th Edition)BiologyISBN:9780134580999Author:Elaine N. Marieb, Katja N. HoehnPublisher:PEARSON
 Biology 2eBiologyISBN:9781947172517Author:Matthew Douglas, Jung Choi, Mary Ann ClarkPublisher:OpenStax
 Anatomy & PhysiologyBiologyISBN:9781259398629Author:McKinley, Michael P., O'loughlin, Valerie Dean, Bidle, Theresa StouterPublisher:Mcgraw Hill Education,
 Molecular Biology of the Cell (Sixth Edition)BiologyISBN:9780815344322Author:Bruce Alberts, Alexander D. Johnson, Julian Lewis, David Morgan, Martin Raff, Keith Roberts, Peter WalterPublisher:W. W. Norton & Company
 Laboratory Manual For Human Anatomy & PhysiologyBiologyISBN:9781260159363Author:Martin, Terry R., Prentice-craver, CynthiaPublisher:McGraw-Hill Publishing Co.
 Inquiry Into Life (16th Edition)BiologyISBN:9781260231700Author:Sylvia S. Mader, Michael WindelspechtPublisher:McGraw Hill Education

Human Anatomy & Physiology (11th Edition)
Biology
ISBN:9780134580999
Author:Elaine N. Marieb, Katja N. Hoehn
Publisher:PEARSON

Biology 2e
Biology
ISBN:9781947172517
Author:Matthew Douglas, Jung Choi, Mary Ann Clark
Publisher:OpenStax

Anatomy & Physiology
Biology
ISBN:9781259398629
Author:McKinley, Michael P., O'loughlin, Valerie Dean, Bidle, Theresa Stouter
Publisher:Mcgraw Hill Education,

Molecular Biology of the Cell (Sixth Edition)
Biology
ISBN:9780815344322
Author:Bruce Alberts, Alexander D. Johnson, Julian Lewis, David Morgan, Martin Raff, Keith Roberts, Peter Walter
Publisher:W. W. Norton & Company

Laboratory Manual For Human Anatomy & Physiology
Biology
ISBN:9781260159363
Author:Martin, Terry R., Prentice-craver, Cynthia
Publisher:McGraw-Hill Publishing Co.

Inquiry Into Life (16th Edition)
Biology
ISBN:9781260231700
Author:Sylvia S. Mader, Michael Windelspecht
Publisher:McGraw Hill Education