Question

Transcribed Image Text:Learning Goal:
Suppose an object has an initial velocity v₁ at time t; and later, at time tf, has
velocity Vf. The fact that the velocity changes tells us the object undergoes an
acceleration during the time interval At = tf — t₁. From the definition of average
acceleration,
Figure
a =
15
Vf - Vi
tf-ti
=
Δύ
At
we see that the acceleration vector points in the same direction as the vector Av.
This vector is the change in the velocity Av = f - Vi, so to know which way the
acceleration vector points, we have to perform the vector subtraction of — V₁. This
Tactics Box shows how to use vector subtraction to find the acceleration vector.
-
9
1 of 1
Part B
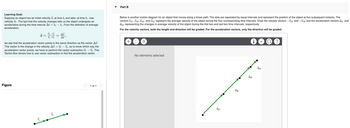
Below is another motion diagram for an object that moves along a linear path. The dots are separated by equal intervals and represent the position of the object at five subsequent instants. The
vectors V21, 32, 43, and 54 represent the average velocity of the object during the four corresponding time intervals. Draw the velocity vectors -√21 and —√43 and the acceleration vectors a31 and
a53 representing the changes in average velocity of the object during the first two and last two time intervals, respectively.
For the velocity vectors, both the length and direction will be graded. For the acceleration vectors, only the direction will be graded.
+ ΣΠ
No elements selected
V21
V32
V43
i
V54
?
Expert Solution
This question has been solved!
Explore an expertly crafted, step-by-step solution for a thorough understanding of key concepts.
This is a popular solution
Trending nowThis is a popular solution!
Step by stepSolved in 4 steps with 22 images

Knowledge Booster
Similar questions
- For a lab report, I have to answer these questions and am confused on how to get these answers from the graphs. The lab is on projectile motion and velocity. I basically threw a ball upwards and recorded its flight on tracker. The two pictures I attached show the vertical velocity by versus time and the horizontal velocity vx versus time. From the velocity vs. time graph(s) determine the acceleration of the ball independently for each component of the motion as a function of time. What is the acceleration of the ball just after it is thrown, and just before it is caught or lands? What is the magnitude of the ball’s acceleration at its highest point? Is this value reasonable? Determine the launch velocity of the ball from the velocity vs. time graphs in the x and y directions. Is this value reasonable? Determine the velocity of the ball at its highest point. Is this value reasonable?arrow_forwardPlease box all answersarrow_forward9 ΔΔΔ Δ Δ ΔΔΔΔΔΔΔΔΔΔΔΔΔΔΔΔΔΔΔΔΔΔΔΔΑ What is the approximate total displacement based on the graph below? use 2 sfs. Approximate the values on each axis to the best of your ability. 560 (velocity mis 50 2240 30 P 10 123 I 3 4 5 Time (s) 1 678 9 2arrow_forward
- The position of a particle along a straight line is given by s(³ 98² +158) ft, where t is in seconds. Part A Determine maximum acceleration during the time interval 0arrow_forwardA motorist travels 70 km at 120 km/h, and 65 km at 95 km/h. ▼ Part A What is the average speed for the trip? Express your answer using three significant figures. Uav = Dig Templates Symbols undo redo reset keyboard shortcuts help ΑΣΦΑ / C km/harrow_forwardA ball moves along a 1D coordinate system with the following motion parameters at time t = 0 s: x₁ = 1.9 m and vo = 0 m/s. The ball has a constant acceleration of 1.1 m/s2 during the entire motion which occurs over a time of 1.2 s. Assume that an error in position of 4% is acceptable in this application over the entire motion. How many rows N will be needed in the table to model the entire motion to within the required error even though you are leaving out the final term of 1/2 a (At )²) present in the exact position expression?arrow_forward
arrow_back_ios
arrow_forward_ios