Related questions
Question
Please finish A.1, A.2 and A.3
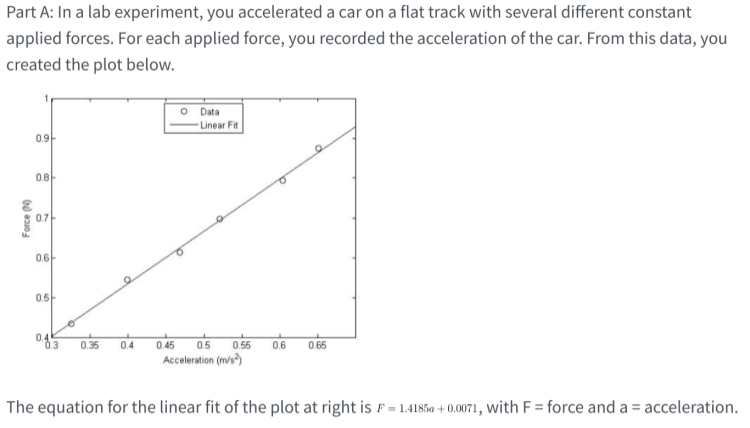

Transcribed Image Text:Part A: In a lab experiment, you accelerated a car on a flat track with several different constant
applied forces. For each applied force, you recorded the acceleration of the car. From this data, you
created the plot below.
O Data
Linear Fit
0.9-
0.8-
0.7-
06
0.5-
0.4
0.35 04 0.45 05
Acceleration (m/s)
0.55
0.6
0.65
The equation for the linear fit of the plot at right is F = 1.4185a + 0.0071, with F = force and a = acceleration.

Transcribed Image Text:Part A.1
The slope of a line can be defined as slope = . Prove that the correct unit for the
slope of the linear fit line is kg. For reference, in = 1kg.m/8°.
Part A.2
Assuming the true mass of the car is 1.4580 kg, what is the percent error between the
measured mass of the car from the linear fit line and the true mass of the car?
Part A.3
Describe two sources of error in the experiment as you performed it in the lab that
could have caused differences between the true mass and the measured (graphical) mass of the car.
Expert Solution
This question has been solved!
Explore an expertly crafted, step-by-step solution for a thorough understanding of key concepts.

This is a popular solution

Trending nowThis is a popular solution!

Step by stepSolved in 5 steps

Knowledge Booster

Similar questions
- K Solve for the indicated variable. Assume all variables are positive. QV₁ QV₂ T. L T₂ ; for T₁ (Simplify your answer.)arrow_forwardPlease help with physics hw (see image, there are two parts to this problem)arrow_forwardI need help on this problem: In the following right triangle, side c = 25 m and angle theta = 53.13. Find each of the following. Express each answer to the correct number of significant figure and use scientific notation if needed.arrow_forward
- A jet leaves palermo, sicily, whose latitute is 38 degrees N flying due west. Eventually it returns to palermo again. Assuming that the earth has a 3960-mile radius: a.) find the distance the jet travels b.)find the distance from palermo to the equator along the surface of the earth. SHOW WORK AND PICTURESarrow_forwardHello, can you please help me do a, b and carrow_forwardAfter Physics Lab, a student undergoes displacements (moves) -60 m East +20 m North. a. What was the magnitude and angle for their total displacement?arrow_forward
arrow_back_ios
arrow_forward_ios