ENGR.ECONOMIC ANALYSIS
14th Edition
ISBN: 9780190931919
Author: NEWNAN
Publisher: Oxford University Press
expand_more
expand_more
format_list_bulleted
Question
thumb_up100%
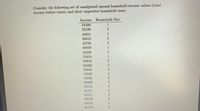
Part A: Differentiate between measures of annual income. Is it better to describe a region’s ‘typical’ standard of living based on mean annual income measures? If not, what would you suggest as a better descriptive statistic?
Part B: Differentiate between income and wealth. Why is income data so prevalent while wealth data so rare? Finally, explain two different methods of measuring wealth.

Transcribed Image Text:Consider the following set of unadjusted annual household income values (total
income before taxes) and their respective household sizes:
Income
Household Size
24480
1
32528
2.
34021
1.
36816
43785
4
46628
1
53226
55854
58634
3
64263
3.
70416
72020
74730
78109
78710
4.
81711
3.
82511
83122
94725
98188
3230NN
Expert Solution
This question has been solved!
Explore an expertly crafted, step-by-step solution for a thorough understanding of key concepts.
Step by stepSolved in 2 steps

Knowledge Booster
Learn more about
Need a deep-dive on the concept behind this application? Look no further. Learn more about this topic, economics and related others by exploring similar questions and additional content below.Similar questions
- Answer the question belowarrow_forwardThe following table shows the labor market data for the U.S. working age population for 2022. The data are from the Bureau of Labor Statistics (I have made slight modifications to some of the numbers in order to get nice ratios). Civilian non-institutional population Civilian labor force Men 25 to 54 Years old 63,122,000 55,900,843 Women 25 to 54 Years old 64,039,000 48,934,000 Here is the issue. In the United States childcare services are very expensive: about $10,000 to $15,000 per child per year, depending on the state. This means that a low-income family with two kids and an annual income of, say $40,000, has to pay 50% to 75% of its income to childcare. Many women who cannot afford such expensive childcare services have to stay home to take care of their kids. This is one reason (but not the only one) that keeps women out of the labor force. For the sake of this exercise let's assume that high childcare costs are the only reasons for low women's participation…arrow_forwardThe table shows the distribution of personal income in the United States in 2016. Percentage of total income Households Poorest 20 percent 3.1 Second 20 percent Third 20 percent Fourth 20 percent Richest 20 percent 8.2 14.3 23.2 51.2 For all U.S. households to receive an equal share of income, what percentage of total income would the poorest 20 percent of households have to receive from higher-income groups? What percentage would the second poorest have to receive? >>> Answer to 1 decimal place. The poorest 20 percent of households would have to receive percent. The second poorest 20 percent of households have to receive percent.arrow_forward
- The graph shows a Lorenz curve for an economy with a total income of 30000; Share of Income a 40% 60% 80% 100% A B C D E 20% suppose that A=100%, b=48%, c=23%, D=9% and E=2% What is the income share of each quintile in percentage? (enter the numbers with % sign, such as 5%) Quintile 1 (poorest quintile) = type your answer... type your answer... type your answer... Percentile Quintile 2 = Quintile 3 = Quintile 4=arrow_forward1. Give two examples of any facts (data) on older-adults (65+) population that surprised you or you did not expect. Erber provides a lot of data on topics including: demography and population trends, Baby Boomers, residence patterns, as well facts on health, education, gender, and poverty.arrow_forwardHelp!arrow_forward
arrow_back_ios
arrow_forward_ios
Recommended textbooks for you

 Principles of Economics (12th Edition)EconomicsISBN:9780134078779Author:Karl E. Case, Ray C. Fair, Sharon E. OsterPublisher:PEARSON
 Engineering Economy (17th Edition)EconomicsISBN:9780134870069Author:William G. Sullivan, Elin M. Wicks, C. Patrick KoellingPublisher:PEARSON
 Principles of Economics (MindTap Course List)EconomicsISBN:9781305585126Author:N. Gregory MankiwPublisher:Cengage Learning
 Managerial Economics: A Problem Solving ApproachEconomicsISBN:9781337106665Author:Luke M. Froeb, Brian T. McCann, Michael R. Ward, Mike ShorPublisher:Cengage Learning
 Managerial Economics & Business Strategy (Mcgraw-...EconomicsISBN:9781259290619Author:Michael Baye, Jeff PrincePublisher:McGraw-Hill Education


Principles of Economics (12th Edition)
Economics
ISBN:9780134078779
Author:Karl E. Case, Ray C. Fair, Sharon E. Oster
Publisher:PEARSON

Engineering Economy (17th Edition)
Economics
ISBN:9780134870069
Author:William G. Sullivan, Elin M. Wicks, C. Patrick Koelling
Publisher:PEARSON

Principles of Economics (MindTap Course List)
Economics
ISBN:9781305585126
Author:N. Gregory Mankiw
Publisher:Cengage Learning

Managerial Economics: A Problem Solving Approach
Economics
ISBN:9781337106665
Author:Luke M. Froeb, Brian T. McCann, Michael R. Ward, Mike Shor
Publisher:Cengage Learning

Managerial Economics & Business Strategy (Mcgraw-...
Economics
ISBN:9781259290619
Author:Michael Baye, Jeff Prince
Publisher:McGraw-Hill Education