MATLAB: An Introduction with Applications
6th Edition
ISBN: 9781119256830
Author: Amos Gilat
Publisher: John Wiley & Sons Inc
expand_more
expand_more
format_list_bulleted
Topic Video
Question
Part A B and C urgently need

Transcribed Image Text:a) Draw the wage schedule with y on the x-axis and w(y) on the y-axis. Make sure to label everything
b) What amounts of schooling y will Type 1 workers consider getting? What about Type 2 workers? Do
these workers have to think of schooling as a form of signalling for schooling to act as a signal?
c) What is the schooling schedule facing each of Type 1 and Type 2 workers? (Hint: for each type this is a
conditional function, similar to the wage schedule above). Show the general functional considerations
and then plug in the values and solve for specific conditions
d) Draw a new graph showing the wage schedule and the cost functions for both types. Clearly indicate
the payoff for each type of worker given their choices and y*
e) This setup allows for many signalling equilibria. How many? What are the specific conditions and
results that support these equilibria?
f) Is there an equilibrium supported by this setup (something that could happen given this setup, and
which would be sustained as an equilibrium) such that both types of worker would prefer an equilib-
rium with no signalling at all (if the employer's beliefs supported it? If so, what is it?

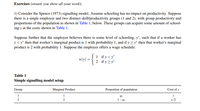
Transcribed Image Text:Exercises (ensure you show all your work):
1) Consider the Spence (1973) signalling model. Assume schooling has no impact on productivity. Suppose
there is a single employer and two distinct skill/productivity groups (1 and 2), with group productivity and
proportions of the population as shown in Table 1, below. These groups can acquire some amount of school-
ing y at the costs shown in Table 1.
Suppose further that the employer believes there is some level of schooling, y", such that if a worker has
y < y* then that worker's marginal product is 1 with probability 1, and if y 2 y* then that worker's marginal
product is 2 with probability 1. Suppose the employer offers a wage schedule:
1 if y<y*
2 if y>y*
w(y) =
Table 1
Simple signalling model setup
Group
Marginal Product
Proportion of population
Cost of y
91
2
1-91
у/2
Expert Solution
This question has been solved!
Explore an expertly crafted, step-by-step solution for a thorough understanding of key concepts.
Step by stepSolved in 2 steps

Knowledge Booster
Learn more about
Need a deep-dive on the concept behind this application? Look no further. Learn more about this topic, statistics and related others by exploring similar questions and additional content below.Similar questions
arrow_back_ios
arrow_forward_ios
Recommended textbooks for you
 MATLAB: An Introduction with ApplicationsStatisticsISBN:9781119256830Author:Amos GilatPublisher:John Wiley & Sons Inc
 Probability and Statistics for Engineering and th...StatisticsISBN:9781305251809Author:Jay L. DevorePublisher:Cengage Learning
 Statistics for The Behavioral Sciences (MindTap C...StatisticsISBN:9781305504912Author:Frederick J Gravetter, Larry B. WallnauPublisher:Cengage Learning
 Elementary Statistics: Picturing the World (7th E...StatisticsISBN:9780134683416Author:Ron Larson, Betsy FarberPublisher:PEARSON
 The Basic Practice of StatisticsStatisticsISBN:9781319042578Author:David S. Moore, William I. Notz, Michael A. FlignerPublisher:W. H. Freeman
 Introduction to the Practice of StatisticsStatisticsISBN:9781319013387Author:David S. Moore, George P. McCabe, Bruce A. CraigPublisher:W. H. Freeman

MATLAB: An Introduction with Applications
Statistics
ISBN:9781119256830
Author:Amos Gilat
Publisher:John Wiley & Sons Inc

Probability and Statistics for Engineering and th...
Statistics
ISBN:9781305251809
Author:Jay L. Devore
Publisher:Cengage Learning

Statistics for The Behavioral Sciences (MindTap C...
Statistics
ISBN:9781305504912
Author:Frederick J Gravetter, Larry B. Wallnau
Publisher:Cengage Learning

Elementary Statistics: Picturing the World (7th E...
Statistics
ISBN:9780134683416
Author:Ron Larson, Betsy Farber
Publisher:PEARSON

The Basic Practice of Statistics
Statistics
ISBN:9781319042578
Author:David S. Moore, William I. Notz, Michael A. Fligner
Publisher:W. H. Freeman

Introduction to the Practice of Statistics
Statistics
ISBN:9781319013387
Author:David S. Moore, George P. McCabe, Bruce A. Craig
Publisher:W. H. Freeman