
MATLAB: An Introduction with Applications
6th Edition
ISBN: 9781119256830
Author: Amos Gilat
Publisher: John Wiley & Sons Inc
expand_more
expand_more
format_list_bulleted
Related questions
Question
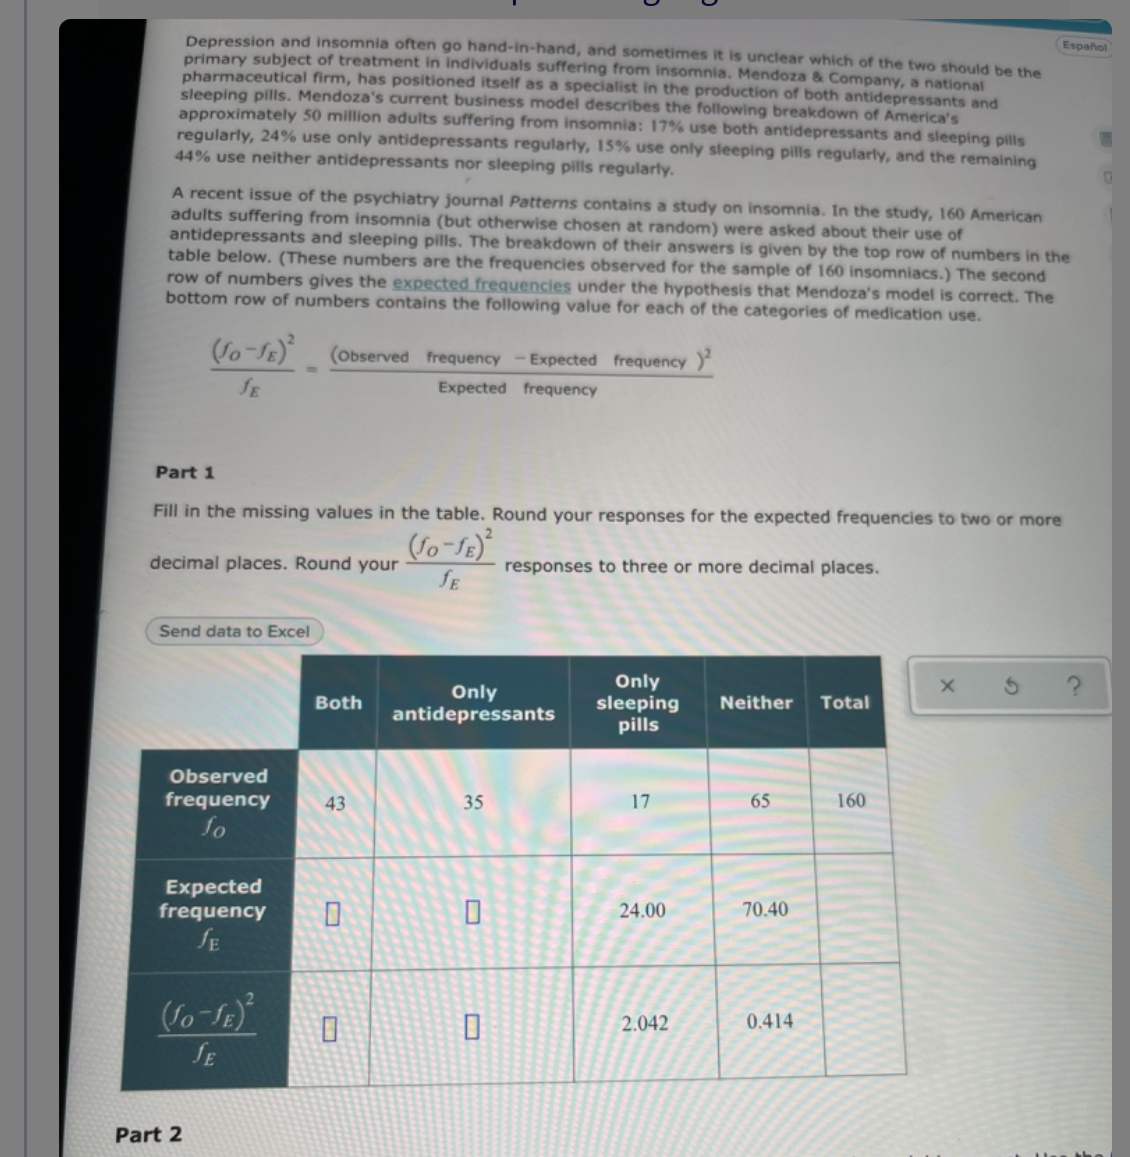

Transcribed Image Text:Depression and insomnia often go hand-in-hand, and sometimes it is unclear which of the two should be the
primary subject of treatment in individuals suffering from insomnia. Mendoza & Company, a national
pharmaceutical firm, has positioned itself as a specialist in the production of both antidepressants and
sleeping pills. Mendoza's current business model describes the following breakdown of America's
approximately 50 million adults suffering from insomnia: 17% use both antidepressants and sleeping pills
regularly, 24% use only antidepressants regularly, 15% use only sleeping pills regularly, and the remaining
44% use neither antidepressants nor sleeping pills regularly.
Español
A recent issue of the psychiatry journal Patterns contains a study on insomnia. In the study, 160 American
adults suffering from insomnia (but otherwise chosen at random) were asked about their use of
antidepressants and sleeping pills. The breakdown of their answers is given by the top row of numbers in the
table below. (These numbers are the frequencies observed for the sample of 160 insomniacs.) The second
row of numbers gives the expected frequencies under the hypothesis that Mendoza's model is correct. The
bottom row of numbers contains the following value for each of the categories of medication use.
So-SE) (oObserved frequency -Expected frequency
fE
Expected frequency
Part 1
Fill in the missing values in the table. Round your responses for the expected frequencies to two or more
decimal places. Round your
responses to three or more decimal places.
SE
Send data to Excel
Only
antidepressants
Only
sleeping
pills
Both
Neither
Total
Observed
frequency
43
35
17
65
160
fo
Expected
frequency
SE
24.00
70.40
2.042
0.414
SE
Part 2

Transcribed Image Text:Part 2
Answer the following to summarize the test of the hypothesis that Mendoza's model is correct.
level of significance for the test.
(a) Determine the type of test statistic to use.
Type of test statistic: (Choose one) ▼
(b) Find the value of the test statistic. (Round your answer to two or more decimal
places.)
(c) Find the critical value. (Round your answer to two or more decimal places.)
(d) Can we conclude that the percentages given in Mendoza's model are incorrect?
OYes ONo
Expert Solution
This question has been solved!
Explore an expertly crafted, step-by-step solution for a thorough understanding of key concepts.

This is a popular solution

Trending nowThis is a popular solution!

Step by stepSolved in 2 steps with 2 images

Knowledge Booster

Similar questions
- his K You are testing the null hypothesis that there is no linear relationship between two variables, X and Y. From your sample of n = 18, you determine that b₁ = 4.3 and Sb₁ = 1.4. a. What is the value of tSTAT? b. At the a=0.05 level of significance, what are the critical values? c. Based on your answers to (a) and (b), what statistical decision should you make? d. Construct a 95% confidence interval estimate of the population slope, B₁. e to search a. What are the hypotheses to test? A. Ho: B₁ = 0 H₁: B₁ #0 © C. Ho: P₁20 H₁: B₁ O OD. Ho: B₁ #0 H₁: B₁ = 0 fg 144 f10 84°F ^ @ fil *** 6464 Clear all h12 mportant Information ce Identification Cards. Two cards have been cle insured. Please destroy your old cards ecome effective. A law enforcement officer South Carolina law. The Insurance rovide this proof. that you have liability insurance meeting ons on the ID Card, only the are listed. For a full list of ease reference the Dri (page 7). omptly of any portant policarrow_forwardT he number of awards earned by students at one high school is recorded. Predictors of the number of awards earned include the type of program in which the student was enrolled (e.g., vocational, general or academic) and the score on their final exam in math. Below is a description of the variables and their levels of measurement Variables Student ID - NOMINAL Math Scores - RATIO Total # of awards - DISCRETE Program Type - NOMINAL (categorical with three levels: (1)general, (2)academic, (3)vocational) Total Students= 200 Total Awards = 194 Total math scores = 10529 Program Type sum = 405 Describe the modality (i.e., shape) of this distribution (please be sure to include the appropriate statistics to support your description)arrow_forwardOnly answer 4 and 5, thank you Use the SPSS information on the following pages to complete your analysis and paper. Respond to the following in your paper. 1. The two variables for this study are age and consumer sense of entitlement. Which one is the independent variable? Which one is the dependent variable? 2. What are the null hypothesis and the alternate hypothesis for this study? 3. What is the R2 for this study? What does the R2 value mean? Be specific to this study in your explanation of the meaning of the R2 value. 4. What is the regression equation for this study? 5. What is the finding for this study, using a significance level of p < .10? What implications does this finding have on marketing? SPSS Regression Variables Entered/Removeda Model Variables Entered Variables Removed Method 1 Ageb . Enter a. Dependent Variable: Entitlement b. All requested variables entered. Model Summary Model R R Square Adjusted R…arrow_forward
- Hi I was wondering how I could solve thisarrow_forward#32arrow_forwardThe data show the number of hours of television watched per day by a sample of 28 people. Use technology to answer parts (a) and (b) below. 0 9 00 6 8 = 5 5 3 0 F3 4 3 4 -6 a. Find the data set's first, second, and third quartiles. Q₁ = Q₂ = Q3 (Type integers or decimals. Do not round.) 5 1 2 3 7 3 9 287 5 9 2 b. Draw a box-and-whisker plot that represents the data set. Choose the answer below. Note that different technologies will produce slightly different results. O A. B. 670 9 6 3 2 0 -co C. 0 3 6 -S 9 Narrow_forward
- I need help with all parts of this question 19arrow_forwardT-TEST FOR INDEPENDENT MEANS 1. Two types of instruments for measuring the amount of sulfur monoxide in the atmosphere are being compared in an air pollution experiment. It is desired to determine whether the types of instruments yield measurement having the same variability. The following readings were recorded for the instrument. Sulfur Monoxide Instrument A Instrument B 0.86 0.87 0.82 0.74 0.75 0.63 0.61 0.55 0.89 0.76 0.64 0.70 0.81 0.69 0.68 0.57 0.65 0.53 Assuming the population of measurements to be approximately normally distributed, test the null hypothesis using two tailed test at 0.05 level of significance.arrow_forwardFor c is the null hypothesis rejected?arrow_forward
arrow_back_ios
SEE MORE QUESTIONS
arrow_forward_ios
Recommended textbooks for you
- MATLAB: An Introduction with ApplicationsStatisticsISBN:9781119256830Author:Amos GilatPublisher:John Wiley & Sons Inc
 Probability and Statistics for Engineering and th...StatisticsISBN:9781305251809Author:Jay L. DevorePublisher:Cengage Learning
 Statistics for The Behavioral Sciences (MindTap C...StatisticsISBN:9781305504912Author:Frederick J Gravetter, Larry B. WallnauPublisher:Cengage Learning
  Elementary Statistics: Picturing the World (7th E...StatisticsISBN:9780134683416Author:Ron Larson, Betsy FarberPublisher:PEARSON
 The Basic Practice of StatisticsStatisticsISBN:9781319042578Author:David S. Moore, William I. Notz, Michael A. FlignerPublisher:W. H. Freeman
 Introduction to the Practice of StatisticsStatisticsISBN:9781319013387Author:David S. Moore, George P. McCabe, Bruce A. CraigPublisher:W. H. Freeman
MATLAB: An Introduction with Applications
Statistics
ISBN:9781119256830
Author:Amos Gilat
Publisher:John Wiley & Sons Inc
Probability and Statistics for Engineering and th...
Statistics
ISBN:9781305251809
Author:Jay L. Devore
Publisher:Cengage Learning
Statistics for The Behavioral Sciences (MindTap C...
Statistics
ISBN:9781305504912
Author:Frederick J Gravetter, Larry B. Wallnau
Publisher:Cengage Learning
Elementary Statistics: Picturing the World (7th E...
Statistics
ISBN:9780134683416
Author:Ron Larson, Betsy Farber
Publisher:PEARSON
The Basic Practice of Statistics
Statistics
ISBN:9781319042578
Author:David S. Moore, William I. Notz, Michael A. Fligner
Publisher:W. H. Freeman
Introduction to the Practice of Statistics
Statistics
ISBN:9781319013387
Author:David S. Moore, George P. McCabe, Bruce A. Craig
Publisher:W. H. Freeman