
MATLAB: An Introduction with Applications
6th Edition
ISBN: 9781119256830
Author: Amos Gilat
Publisher: John Wiley & Sons Inc
expand_more
expand_more
format_list_bulleted
Related questions
Question
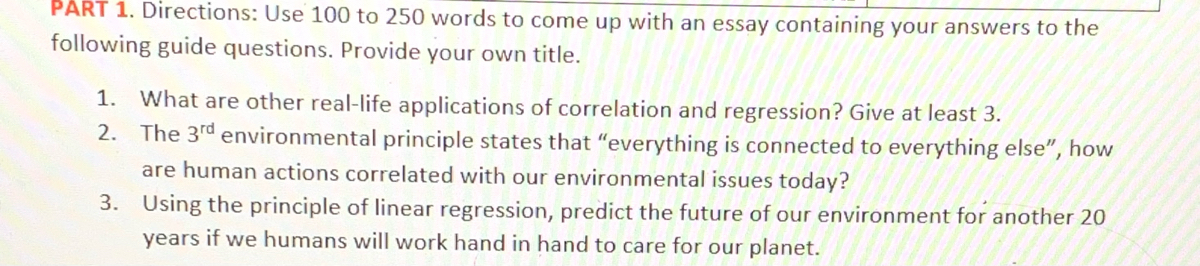

Transcribed Image Text:PART 1. Directions: Use 100 to 250 words to come up with an essay containing your answers to the
following guide questions. Provide your own title.
1.
What are other real-life applications of correlation and regression? Give at least 3.
2. The 3rd environmental principle states that "everything is connected to everything else", how
are human actions correlated with our environmental issues today?
3. Using the principle of linear regression, predict the future of our environment for another 20
years if we humans will work hand in hand to care for our planet.
Expert Solution
This question has been solved!
Explore an expertly crafted, step-by-step solution for a thorough understanding of key concepts.

Step by stepSolved in 3 steps

Knowledge Booster

Similar questions
- Identify the correct statement concerning, r the correlation coefficie between X and Y and the linear regression, Y = aX+b. A. Both can be used to show cause and effect. B. Both quantify the strength of relationship between X and Y. C. X and Y are interchangeable in both relationships. D. Both can be used to make predictions.arrow_forwardHello tutor, please help me to understand this 2 part MCQ question. Thank you. Part A) Based on Image 1, A researcher examined the relationship between weight (y axis) and height (x axis) among 475 male subjects. He graphed the relationship in the scatter diagram below. Weight is measured in pounds, and height in inches. The equation of the regression line is y = 3.86*x – 110.42. Is it reasonable to presume that if a male is 107 inches tall, his weight will be 302.6 pounds? a) Yesb) No Part B) Based on Image 2, A researcher examined the relationship between Variables X and Y among 150 male subjects, and he graphed a scatter plot as seen below. The correlation coefficient for all the 150 data points is about 0.5. Let K be the correlation coefficient for the data points with X values lying between 130 to 150. Which of the following statements is correct?a) K is less than 0.50.b) K is more than 0.50.c) None of the other options.arrow_forwardWhich of the following is true of a linear regression line? a. Located as close as possible to all the points of a scatter chart. B. Is defined by an equation having 2 parameters: the slope and the intercept c. Provides an approximate relationship between the values of two parameters d. All of the abovearrow_forward
- Suppose that a simple linear regression model is appropriate for describing the relationship between y = house price (in dollars) and x = house size (in square feet) for houses in a large city. The population regression line is y = 22,500 + 43x and ?e = 4,000. b) Approximately what proportion of 2,000 sq ft homes would be priced over $110,000? (You may need to use a table. Round your answer to four decimal places.) Approximately what proportion of 2,000 sq ft homes would be priced under $100,000? (You may need to use a table. Round your answer to four decimal places.)arrow_forwardIn this section, we introduced a descriptive measure of the utility of the regression equation for making predictions. a. Identify the term and symbol for that descriptive measure. b. Provide an interpretation.arrow_forwardWhich of the following statements best describes linear regression? A measure of the degree of dependence between two variables. A statistical technique using pairs of data and identifying a line which ‘best fits’ all of the pairs of observations. A measure of the proportion of changes in the dependent variable which can be explained by a change in the independent variable. Shows individual costs against their associated activity levels but makes no attempt to identify a linear relationship between them.arrow_forward
arrow_back_ios
arrow_forward_ios
Recommended textbooks for you
- MATLAB: An Introduction with ApplicationsStatisticsISBN:9781119256830Author:Amos GilatPublisher:John Wiley & Sons Inc
 Probability and Statistics for Engineering and th...StatisticsISBN:9781305251809Author:Jay L. DevorePublisher:Cengage Learning
 Statistics for The Behavioral Sciences (MindTap C...StatisticsISBN:9781305504912Author:Frederick J Gravetter, Larry B. WallnauPublisher:Cengage Learning
  Elementary Statistics: Picturing the World (7th E...StatisticsISBN:9780134683416Author:Ron Larson, Betsy FarberPublisher:PEARSON
 The Basic Practice of StatisticsStatisticsISBN:9781319042578Author:David S. Moore, William I. Notz, Michael A. FlignerPublisher:W. H. Freeman
 Introduction to the Practice of StatisticsStatisticsISBN:9781319013387Author:David S. Moore, George P. McCabe, Bruce A. CraigPublisher:W. H. Freeman
MATLAB: An Introduction with Applications
Statistics
ISBN:9781119256830
Author:Amos Gilat
Publisher:John Wiley & Sons Inc
Probability and Statistics for Engineering and th...
Statistics
ISBN:9781305251809
Author:Jay L. Devore
Publisher:Cengage Learning
Statistics for The Behavioral Sciences (MindTap C...
Statistics
ISBN:9781305504912
Author:Frederick J Gravetter, Larry B. Wallnau
Publisher:Cengage Learning
Elementary Statistics: Picturing the World (7th E...
Statistics
ISBN:9780134683416
Author:Ron Larson, Betsy Farber
Publisher:PEARSON
The Basic Practice of Statistics
Statistics
ISBN:9781319042578
Author:David S. Moore, William I. Notz, Michael A. Fligner
Publisher:W. H. Freeman
Introduction to the Practice of Statistics
Statistics
ISBN:9781319013387
Author:David S. Moore, George P. McCabe, Bruce A. Craig
Publisher:W. H. Freeman