
MATLAB: An Introduction with Applications
6th Edition
ISBN: 9781119256830
Author: Amos Gilat
Publisher: John Wiley & Sons Inc
expand_more
expand_more
format_list_bulleted
Related questions
Question
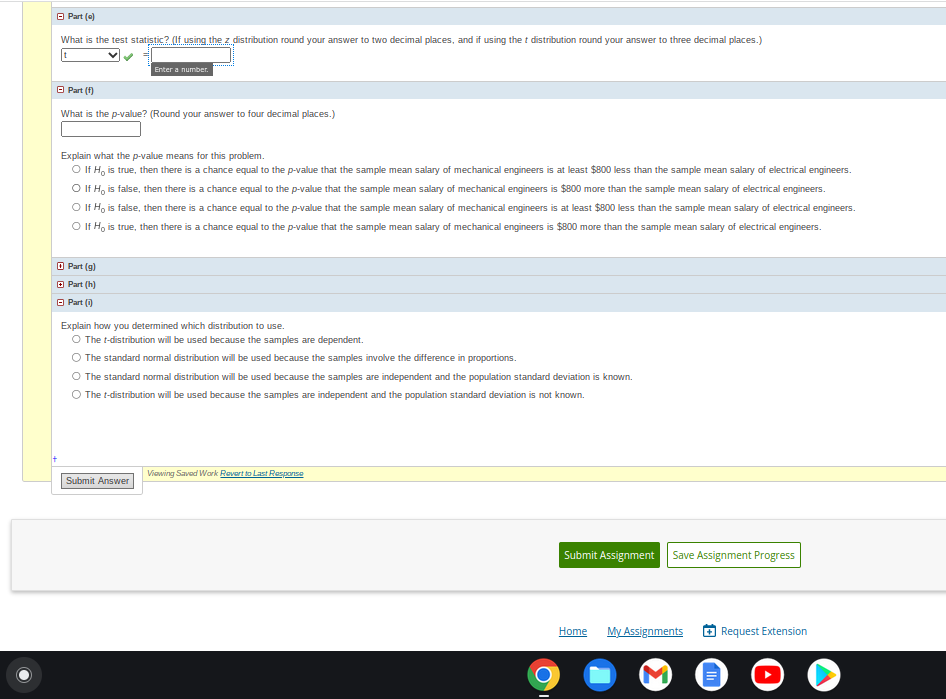

Transcribed Image Text:Part (0)
What is the test statistic? (If using the z distribution round your answer to two decimal places, and if using the t distribution round your answer to three decimal places.)
Part (f)
What is the p-value? (Round your answer to four decimal places.)
Enter a number.
Explain what the p-value means for this problem.
O If H, is true, then there is a chance equal to the p-value that the sample mean salary of mechanical engineers is at least $800 less than the sample mean salary of electrical engineers.
O If H, is false, then there is a chance equal to the p-value that the sample mean salary of mechanical engineers is $800 more than the sample mean salary of electrical engineers.
O If Ho is false, then there is a chance equal to the p-value that the sample mean salary of mechanical engineers is at least $800 less than the sample mean salary of electrical engineers.
O If Ho is true, then there is a chance equal to the p-value that the sample mean salary of mechanical engineers is $800 more than the sample mean salary of electrical engineers.
□ Part (g)
Part (h)
Ⓒ Part (1)
Explain how you determined which distribution to use.
O The t-distribution will be used because the samples are dependent.
The standard normal distribution will be used because the samples involve the difference in proportions.
The standard normal distribution will be used because the samples are independent and the population standard deviation is known.
O The t-distribution will be used because the samples are independent and the population standard deviation is not known.
Submit Answer
Viewing Saved Work Revert to Last Response
O
Submit Assignment Save Assignment Progress
Home
My Assignments
|||||_||
Request Extension
![ASK YOUR TEACHER
5. [4/14 Points] DETAILS
Mean entry-level salaries for college graduates with mechanical engineering degrees and electrical engineering degrees are believed to be approximately the same. A recruiting office thinks that the mean mechanical engineering salary is actually lower than the mean electrical engineering salary.
The recruiting office randomly surveys 44 entry level mechanical engineers and 60 entry level electrical engineers. Their mean salaries were $46,100 and $46,900, respectively. Their standard deviations were $3450 and $4210, respectively. Conduct a hypothesis test at the 5% level to determine
If you agree that the mean entry-level mechanical engineering salary is lower than the mean entry-level electrical engineering salary. Let the subscript m = mechanical and e = electrical.
NOTE: If you are using a Student's t-distribution for the problem, including for paired data, you may assume that the underlying population normally distributed. (In general, you must first prove that assumption, though.)
PREVIOUS ANSWERS
103
ILLOWSKYINTROSTAT1 10.1.081.HW.
Part (a)
□ Part (b)
Part (c)
Part (d)
State the distribution to use for the test. (Enter your answer in the form z or to where df is the degrees of freedom. Round your answer to two decimal places.)
MY NOTES](https://content.bartleby.com/qna-images/question/10bb091d-cccf-46db-9999-0ab4c0d9541d/797afd4c-dbfe-44c9-930c-8c96e3f70749/3h8jaat_processed.png)
Transcribed Image Text:ASK YOUR TEACHER
5. [4/14 Points] DETAILS
Mean entry-level salaries for college graduates with mechanical engineering degrees and electrical engineering degrees are believed to be approximately the same. A recruiting office thinks that the mean mechanical engineering salary is actually lower than the mean electrical engineering salary.
The recruiting office randomly surveys 44 entry level mechanical engineers and 60 entry level electrical engineers. Their mean salaries were $46,100 and $46,900, respectively. Their standard deviations were $3450 and $4210, respectively. Conduct a hypothesis test at the 5% level to determine
If you agree that the mean entry-level mechanical engineering salary is lower than the mean entry-level electrical engineering salary. Let the subscript m = mechanical and e = electrical.
NOTE: If you are using a Student's t-distribution for the problem, including for paired data, you may assume that the underlying population normally distributed. (In general, you must first prove that assumption, though.)
PREVIOUS ANSWERS
103
ILLOWSKYINTROSTAT1 10.1.081.HW.
Part (a)
□ Part (b)
Part (c)
Part (d)
State the distribution to use for the test. (Enter your answer in the form z or to where df is the degrees of freedom. Round your answer to two decimal places.)
MY NOTES
Expert Solution
This question has been solved!
Explore an expertly crafted, step-by-step solution for a thorough understanding of key concepts.

Step by stepSolved in 2 steps with 2 images

Knowledge Booster

Similar questions
- Use the expression in the accompanying discussion of sample size to find the size of each sample if you want to estimate the difference between proportions of men and women who own smartphones assume that you want 99% confidence that your area is no more than 0.045arrow_forwardOnly 2nd partarrow_forwardNeed help with this Intro to probability and statistics homework problem. Below the homework problem is the answers from the textbook. Make sure your handwriting is neat and readable.arrow_forward
- Need help with ONLY part (d) on this Intro to probability and statistics homework problem. Below the homework problem is the answers from the textbook. Make sure your handwriting is neat and readable.arrow_forwardcould you write out steps for b and c pleasearrow_forward7:19 APPLICATION QUESTIONS Directions: This class is like a series of word problems. Not only with the problems be in words, but also you will have to explain what the statistical results mean in words. Therefore, the skill of going from words to math and math to words will be crucial. Write the italicized portion of each statement in mathematical notation. Only the italicized portion needs to be translated into notation: 5G UC lll 23% Example: Test whether the mean of a population is 12. Answer: μ = 12 13. A researcher took a sample. The mean of the sample was 192. 14. They assumed that the population standard deviation was 0.174. 15. An analyst wanted to test whether the population mean was more than 25. 16. A sample was taken and its standard deviation was 7.3. 17. A sample of 30 tax returns was taken, so the sample size is 30. 18. Is the mean of this population smaller than 14? 19. A researcher argued that the population mean was not 215. 20. Test whether the population proportion…arrow_forward
- Need help with this Intro to probability and statistics homework problem. Below the homework problem is the answers from the textbook. Make sure your handwriting is neat and readable.arrow_forwardFill in the blank. A p-value is the probability Choose the correct answer below. O A. Ap-value is the probability that the null hypothesis is true. B. A p-value is the probability of observing the actual result, a sample mean, for example, or something more unusual just by chance if the null hypothesis is false. c. Ap-value is the probability of observing the actual result, a sample mean, for example. D. A p-value is the probability of observing the actual result, a sample mean, for example, or something more unusual just by chance if the null hypothesis is true.arrow_forwardSome states now allow online gambling. As a marketing manager for a casino, you need to determine the percentage of adults in those states who gamble online. How many adults must you survey in order to be 90% confident that your estimate is in error by no more than one percentage point? Complete parts (a) and (b) below. a. Assume that nothing is known about the percentage of adults who gamble online. n=0 (Round up to the nearest integer.) b. Assume that 18% of all adults gamble online. n= (Round up to the nearest integer.)arrow_forward
arrow_back_ios
arrow_forward_ios
Recommended textbooks for you
- MATLAB: An Introduction with ApplicationsStatisticsISBN:9781119256830Author:Amos GilatPublisher:John Wiley & Sons Inc
 Probability and Statistics for Engineering and th...StatisticsISBN:9781305251809Author:Jay L. DevorePublisher:Cengage Learning
 Statistics for The Behavioral Sciences (MindTap C...StatisticsISBN:9781305504912Author:Frederick J Gravetter, Larry B. WallnauPublisher:Cengage Learning
  Elementary Statistics: Picturing the World (7th E...StatisticsISBN:9780134683416Author:Ron Larson, Betsy FarberPublisher:PEARSON
 The Basic Practice of StatisticsStatisticsISBN:9781319042578Author:David S. Moore, William I. Notz, Michael A. FlignerPublisher:W. H. Freeman
 Introduction to the Practice of StatisticsStatisticsISBN:9781319013387Author:David S. Moore, George P. McCabe, Bruce A. CraigPublisher:W. H. Freeman
MATLAB: An Introduction with Applications
Statistics
ISBN:9781119256830
Author:Amos Gilat
Publisher:John Wiley & Sons Inc
Probability and Statistics for Engineering and th...
Statistics
ISBN:9781305251809
Author:Jay L. Devore
Publisher:Cengage Learning
Statistics for The Behavioral Sciences (MindTap C...
Statistics
ISBN:9781305504912
Author:Frederick J Gravetter, Larry B. Wallnau
Publisher:Cengage Learning
Elementary Statistics: Picturing the World (7th E...
Statistics
ISBN:9780134683416
Author:Ron Larson, Betsy Farber
Publisher:PEARSON
The Basic Practice of Statistics
Statistics
ISBN:9781319042578
Author:David S. Moore, William I. Notz, Michael A. Fligner
Publisher:W. H. Freeman
Introduction to the Practice of Statistics
Statistics
ISBN:9781319013387
Author:David S. Moore, George P. McCabe, Bruce A. Craig
Publisher:W. H. Freeman