
MATLAB: An Introduction with Applications
6th Edition
ISBN: 9781119256830
Author: Amos Gilat
Publisher: John Wiley & Sons Inc
expand_more
expand_more
format_list_bulleted
Related questions
Question
11
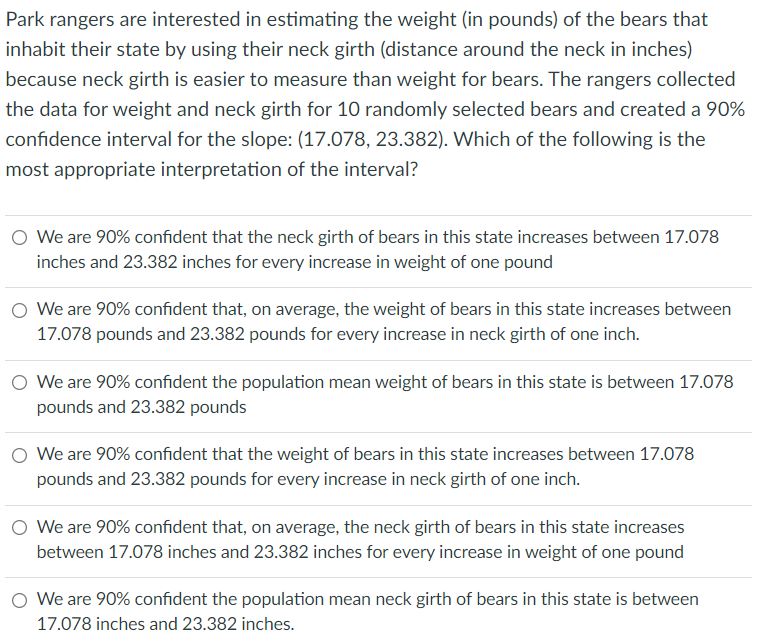

Transcribed Image Text:Park rangers are interested in estimating the weight (in pounds) of the bears that
inhabit their state by using their neck girth (distance around the neck in inches)
because neck girth is easier to measure than weight for bears. The rangers collected
the data for weight and neck girth for 10 randomly selected bears and created a 90%
confidence interval for the slope: (17.078, 23.382). Which of the following is the
most appropriate interpretation of the interval?
O We are 90% confident that the neck girth of bears in this state increases between 17.078
inches and 23.382 inches for every increase in weight of one pound
We are 90% confident that, on average, the weight of bears in this state increases between
17.078 pounds and 23.382 pounds for every increase in neck girth of one inch.
We are 90% confident the population mean weight of bears in this state is between 17.078
pounds and 23.382 pounds
O We are 90% confident that the weight of bears in this state increases between 17.078
pounds and 23.382 pounds for every increase in neck girth of one inch.
O We are 90% confident that, on average, the neck girth of bears in this state increases
between 17.078 inches and 23.382 inches for every increase in weight of one pound
O We are 90% confident the population mean neck girth of bears in this state is between
17.078 inches and 23.382 inches.
Expert Solution
This question has been solved!
Explore an expertly crafted, step-by-step solution for a thorough understanding of key concepts.

This is a popular solution

Trending nowThis is a popular solution!

Step by stepSolved in 2 steps

Knowledge Booster

Similar questions
Recommended textbooks for you
- MATLAB: An Introduction with ApplicationsStatisticsISBN:9781119256830Author:Amos GilatPublisher:John Wiley & Sons Inc
 Probability and Statistics for Engineering and th...StatisticsISBN:9781305251809Author:Jay L. DevorePublisher:Cengage Learning
 Statistics for The Behavioral Sciences (MindTap C...StatisticsISBN:9781305504912Author:Frederick J Gravetter, Larry B. WallnauPublisher:Cengage Learning
  Elementary Statistics: Picturing the World (7th E...StatisticsISBN:9780134683416Author:Ron Larson, Betsy FarberPublisher:PEARSON
 The Basic Practice of StatisticsStatisticsISBN:9781319042578Author:David S. Moore, William I. Notz, Michael A. FlignerPublisher:W. H. Freeman
 Introduction to the Practice of StatisticsStatisticsISBN:9781319013387Author:David S. Moore, George P. McCabe, Bruce A. CraigPublisher:W. H. Freeman
MATLAB: An Introduction with Applications
Statistics
ISBN:9781119256830
Author:Amos Gilat
Publisher:John Wiley & Sons Inc
Probability and Statistics for Engineering and th...
Statistics
ISBN:9781305251809
Author:Jay L. Devore
Publisher:Cengage Learning
Statistics for The Behavioral Sciences (MindTap C...
Statistics
ISBN:9781305504912
Author:Frederick J Gravetter, Larry B. Wallnau
Publisher:Cengage Learning
Elementary Statistics: Picturing the World (7th E...
Statistics
ISBN:9780134683416
Author:Ron Larson, Betsy Farber
Publisher:PEARSON
The Basic Practice of Statistics
Statistics
ISBN:9781319042578
Author:David S. Moore, William I. Notz, Michael A. Fligner
Publisher:W. H. Freeman
Introduction to the Practice of Statistics
Statistics
ISBN:9781319013387
Author:David S. Moore, George P. McCabe, Bruce A. Craig
Publisher:W. H. Freeman