MATLAB: An Introduction with Applications
6th Edition
ISBN: 9781119256830
Author: Amos Gilat
Publisher: John Wiley & Sons Inc
expand_more
expand_more
format_list_bulleted
Concept explainers
Question
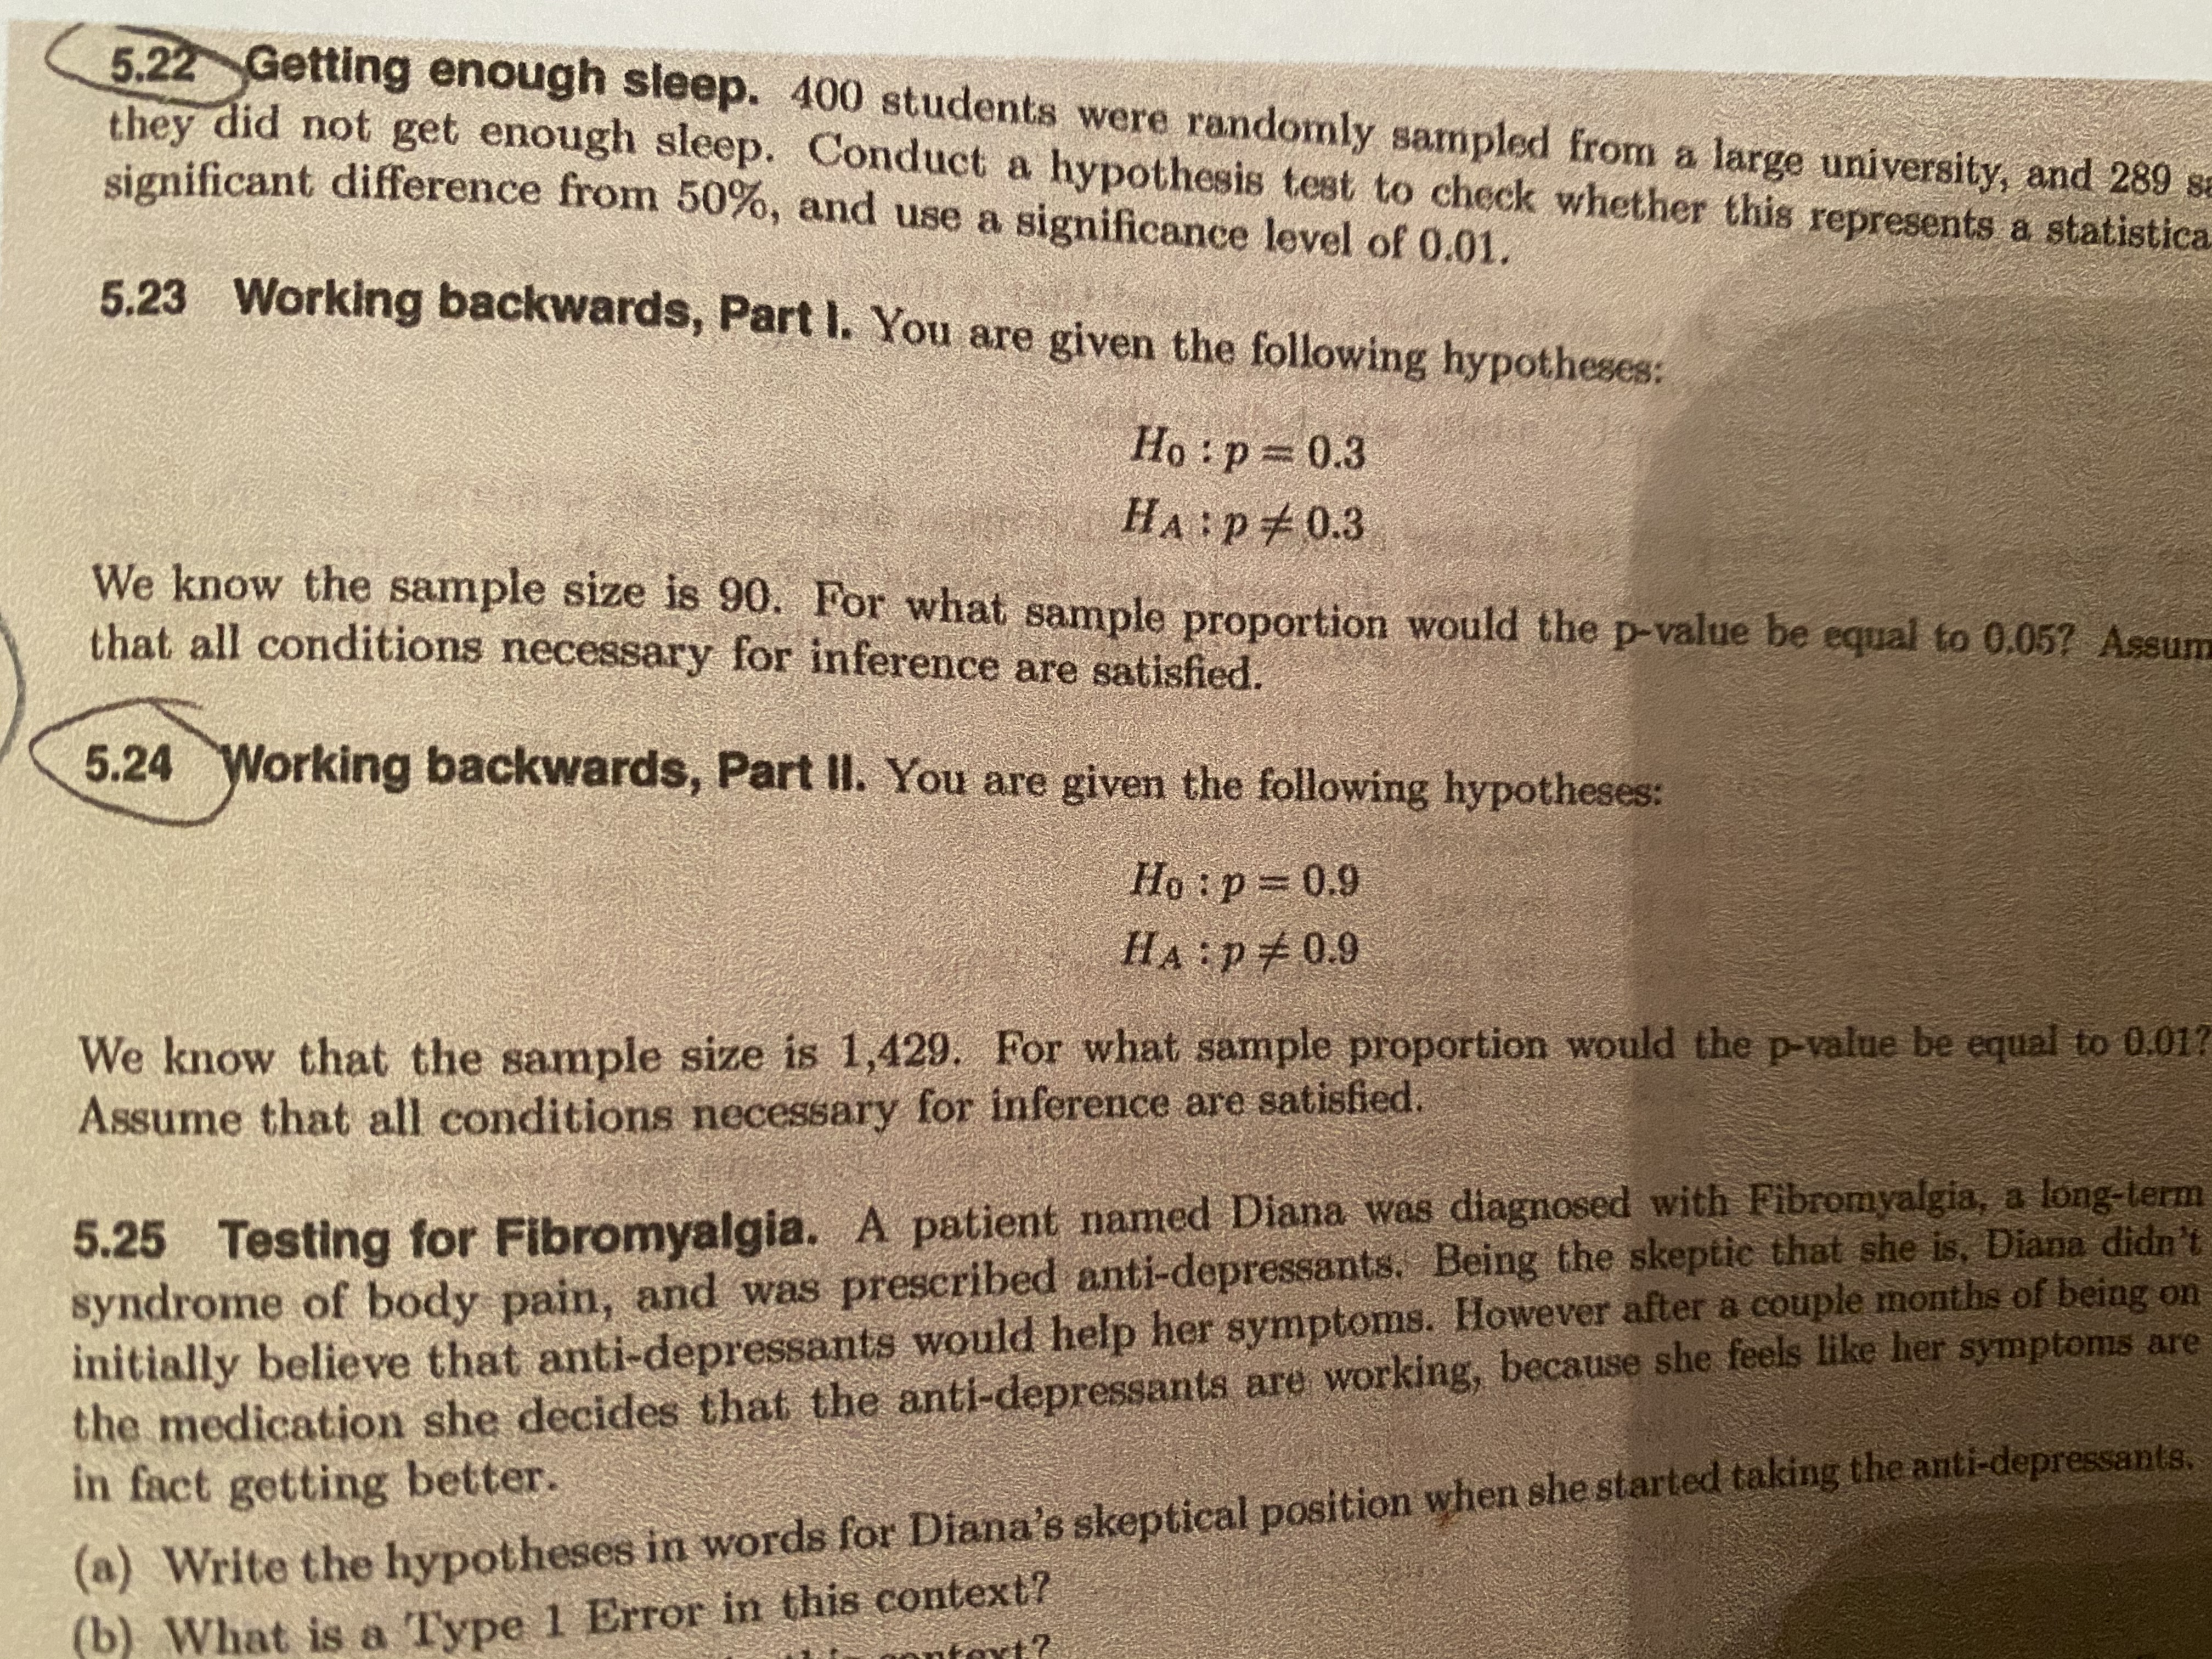
What am I doing wrong on 5.24?
i keep getting .92 for the answer for p-hat.
please write the answer out the long way this time. Thanks.

Transcribed Image Text:**5.22 Getting Enough Sleep**
400 students were randomly sampled from a large university, and 289 students said they did not get enough sleep. Conduct a hypothesis test to check whether this represents a statistically significant difference from 70% and use a significance level of 0.01.
---
**5.23 Working Backwards, Part I**
You are given the following hypotheses:
- \(H_0: p = 0.3\)
- \(H_A: p \neq 0.3\)
We know the sample size is 90. For what sample proportion would the p-value be equal to 0.067? Assume that all conditions necessary for inference are satisfied.
---
**5.24 Working Backwards, Part II**
You are given the following hypotheses:
- \(H_0: p = 0.9\)
- \(H_A: p \neq 0.9\)
We know that the sample size is 90. For what sample proportion would the p-value be equal to 0.017? Assume that all conditions necessary for inference are satisfied.
---
**5.25 Testing for Fibromyalgia**
A patient named Diana was diagnosed with fibromyalgia, a long-term syndrome of body pain, and was prescribed anti-depressants. Being the skeptical type, Diana was suspicious of being on anti-depressants and initially believed that anti-depressants would help only a couple of her symptoms. However, after a few months on the medication, she decides that the anti-depressants are working, because she feels like her symptoms are in fact getting better.
(a) Write the hypotheses in words for Diana's skeptical position when she started taking the anti-depressants.
(b) What is a Type 1 Error in this context?
![**5.24 Working Backwards, Part II**
**Step 1:**
- Given test is a two-tail test.
- Population proportion is \( p = 0.9 \).
- Sample size is \( n = 1429 \).
**Hypotheses:**
- Null hypothesis (\( H_0 \)): \( p = 0.9 \)
- Alternative hypothesis (\( H_a \)): \( p \neq 0.9 \)
**Step 2:**
- Significance level \( p = 0.05 \)?
**Calculate Sample Proportion (\( \hat{p} \)):**
1. **P-value:**
- \( p = 0.01 \) for a two-tailed test.
- \( Z = \pm 2.58 \) for 99% confidence interval.
2. **Standard Error (SE):**
\[
SE = \sqrt{\frac{p(1-p)}{n}} = \sqrt{\frac{0.9(1-0.9)}{1429}} = 0.0079
\]
3. **Calculate \( \hat{p} \):**
- Use formula for Z-score:
\[
Z = \frac{\hat{p} - p}{SE}
\]
\[
2.58 = \frac{\hat{p} - 0.9}{0.0079}
\]
\[
\hat{p} - 0.9 = 2.58 \times 0.0079
\]
\[
\hat{p} = 0.9 + 0.0204 = 0.92
\]
**Conclusion:**
- The sample proportion (\( \hat{p} \)) is calculated to be \( 0.92 \).](https://content.bartleby.com/qna-images/question/b45547dd-c628-45a5-8939-a65a109b41c7/64b28df6-827d-41be-bbb8-5484e3d13024/02zg1tx.jpeg)
Transcribed Image Text:**5.24 Working Backwards, Part II**
**Step 1:**
- Given test is a two-tail test.
- Population proportion is \( p = 0.9 \).
- Sample size is \( n = 1429 \).
**Hypotheses:**
- Null hypothesis (\( H_0 \)): \( p = 0.9 \)
- Alternative hypothesis (\( H_a \)): \( p \neq 0.9 \)
**Step 2:**
- Significance level \( p = 0.05 \)?
**Calculate Sample Proportion (\( \hat{p} \)):**
1. **P-value:**
- \( p = 0.01 \) for a two-tailed test.
- \( Z = \pm 2.58 \) for 99% confidence interval.
2. **Standard Error (SE):**
\[
SE = \sqrt{\frac{p(1-p)}{n}} = \sqrt{\frac{0.9(1-0.9)}{1429}} = 0.0079
\]
3. **Calculate \( \hat{p} \):**
- Use formula for Z-score:
\[
Z = \frac{\hat{p} - p}{SE}
\]
\[
2.58 = \frac{\hat{p} - 0.9}{0.0079}
\]
\[
\hat{p} - 0.9 = 2.58 \times 0.0079
\]
\[
\hat{p} = 0.9 + 0.0204 = 0.92
\]
**Conclusion:**
- The sample proportion (\( \hat{p} \)) is calculated to be \( 0.92 \).
Expert Solution
This question has been solved!
Explore an expertly crafted, step-by-step solution for a thorough understanding of key concepts.
This is a popular solution
Trending nowThis is a popular solution!
Step by stepSolved in 2 steps

Knowledge Booster
Learn more about
Need a deep-dive on the concept behind this application? Look no further. Learn more about this topic, statistics and related others by exploring similar questions and additional content below.Similar questions
arrow_back_ios
arrow_forward_ios
Recommended textbooks for you
 MATLAB: An Introduction with ApplicationsStatisticsISBN:9781119256830Author:Amos GilatPublisher:John Wiley & Sons Inc
 Probability and Statistics for Engineering and th...StatisticsISBN:9781305251809Author:Jay L. DevorePublisher:Cengage Learning
 Statistics for The Behavioral Sciences (MindTap C...StatisticsISBN:9781305504912Author:Frederick J Gravetter, Larry B. WallnauPublisher:Cengage Learning
 Elementary Statistics: Picturing the World (7th E...StatisticsISBN:9780134683416Author:Ron Larson, Betsy FarberPublisher:PEARSON
 The Basic Practice of StatisticsStatisticsISBN:9781319042578Author:David S. Moore, William I. Notz, Michael A. FlignerPublisher:W. H. Freeman
 Introduction to the Practice of StatisticsStatisticsISBN:9781319013387Author:David S. Moore, George P. McCabe, Bruce A. CraigPublisher:W. H. Freeman

MATLAB: An Introduction with Applications
Statistics
ISBN:9781119256830
Author:Amos Gilat
Publisher:John Wiley & Sons Inc

Probability and Statistics for Engineering and th...
Statistics
ISBN:9781305251809
Author:Jay L. Devore
Publisher:Cengage Learning

Statistics for The Behavioral Sciences (MindTap C...
Statistics
ISBN:9781305504912
Author:Frederick J Gravetter, Larry B. Wallnau
Publisher:Cengage Learning

Elementary Statistics: Picturing the World (7th E...
Statistics
ISBN:9780134683416
Author:Ron Larson, Betsy Farber
Publisher:PEARSON

The Basic Practice of Statistics
Statistics
ISBN:9781319042578
Author:David S. Moore, William I. Notz, Michael A. Fligner
Publisher:W. H. Freeman

Introduction to the Practice of Statistics
Statistics
ISBN:9781319013387
Author:David S. Moore, George P. McCabe, Bruce A. Craig
Publisher:W. H. Freeman