FINANCIAL ACCOUNTING
10th Edition
ISBN: 9781259964947
Author: Libby
Publisher: MCG
expand_more
expand_more
format_list_bulleted
Concept explainers
Question

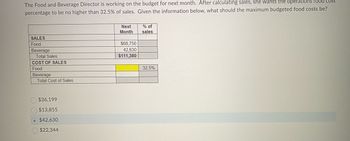
Transcribed Image Text:The Food and Beverage Director is working on the budget for next month. After calculating sales, she wants the operations food cost percentage to be no higher than 32.5% of sales. Given the information below, what should the maximum budgeted food costs be?
**Sales Table**
| Category | Next Month | % of Sales |
|------------|------------|------------|
| Food | $68,750 | |
| Beverage | $42,630 | |
| **Total Sales** | **$111,380** | |
**Cost of Sales Table**
| Category | Cost | % of Sales |
|------------|--------|------------|
| Food | | 32.5% |
| Beverage | | |
| **Total Cost of Sales** | | |
**Options:**
- $36,199
- $13,855
- $42,630
- $22,344
**Diagram Explanation:**
The tables provide a breakdown of sales and desired cost distribution. The first table outlines projected sales in two categories: food ($68,750) and beverages ($42,630), leading to total sales of $111,380. The second table shows the budgeted cost percentage for food as 32.5% of the total sales.
The options at the end list potential maximum budgeted food costs. The correct answer is determined using the desired percentage of sales for food costs (32.5% of $111,380).
Expert Solution
This question has been solved!
Explore an expertly crafted, step-by-step solution for a thorough understanding of key concepts.
Step by stepSolved in 2 steps

Knowledge Booster
Learn more about
Need a deep-dive on the concept behind this application? Look no further. Learn more about this topic, accounting and related others by exploring similar questions and additional content below.Similar questions
- How does a flexible budget based on two cost drivers differ from a flexible budget based on asingle cost driver?arrow_forwardA standard price is the same as a(n): budgeted price actual price budgeted quantity favorable price actual ratearrow_forwardWhich of the following is not another way of describing the marginal propensity to consume? a. autonomous consumption spending b. the slope of the consumption function c. the amount by which real consumption spending rises when real disposable income increases by one dollar d. MPC e. the change in real consumption spending divided by the change in real disposable incomearrow_forward
- What is the difference between a direct cost and an opportunity cost? Can you show the difference between these costs by sharing one (1) out-of-pocket cost and one (1) opportunity cost for something you did today?arrow_forwards Kristen Lu purchased a used automobile for $28,150 at the beginning of last year and incurred the following operating costs: Depreciation ($28,150+ 5 years) Insurance Garage rent Automobile tax and license Variable operating cost $ 5,630 $ 2,900 $ 1,500 $ 770 $ 0.07 per mile The variable operating cost consists of gasoline, oil, tires, maintenance, and repairs. Kristen estimates that, at her current rate of usage, the car will have zero resale value in five years, so the annual straight-line depreciation is $5,630. The car is kept in a garage for a monthly fee. Average fixed cost per mile Variable operating cost per mile Average cost per mile Required: 1. Kristen drove the car 27,000 miles last year. Compute the average cost per mile of owning and operating the car. (Round your answers to 2 decimal places.)arrow_forward
arrow_back_ios
arrow_forward_ios
Recommended textbooks for you

 AccountingAccountingISBN:9781337272094Author:WARREN, Carl S., Reeve, James M., Duchac, Jonathan E.Publisher:Cengage Learning,
 Accounting Information SystemsAccountingISBN:9781337619202Author:Hall, James A.Publisher:Cengage Learning,
 Horngren's Cost Accounting: A Managerial Emphasis...AccountingISBN:9780134475585Author:Srikant M. Datar, Madhav V. RajanPublisher:PEARSON
 Intermediate AccountingAccountingISBN:9781259722660Author:J. David Spiceland, Mark W. Nelson, Wayne M ThomasPublisher:McGraw-Hill Education
 Financial and Managerial AccountingAccountingISBN:9781259726705Author:John J Wild, Ken W. Shaw, Barbara Chiappetta Fundamental Accounting PrinciplesPublisher:McGraw-Hill Education


Accounting
Accounting
ISBN:9781337272094
Author:WARREN, Carl S., Reeve, James M., Duchac, Jonathan E.
Publisher:Cengage Learning,

Accounting Information Systems
Accounting
ISBN:9781337619202
Author:Hall, James A.
Publisher:Cengage Learning,

Horngren's Cost Accounting: A Managerial Emphasis...
Accounting
ISBN:9780134475585
Author:Srikant M. Datar, Madhav V. Rajan
Publisher:PEARSON

Intermediate Accounting
Accounting
ISBN:9781259722660
Author:J. David Spiceland, Mark W. Nelson, Wayne M Thomas
Publisher:McGraw-Hill Education

Financial and Managerial Accounting
Accounting
ISBN:9781259726705
Author:John J Wild, Ken W. Shaw, Barbara Chiappetta Fundamental Accounting Principles
Publisher:McGraw-Hill Education