MATLAB: An Introduction with Applications
6th Edition
ISBN: 9781119256830
Author: Amos Gilat
Publisher: John Wiley & Sons Inc
expand_more
expand_more
format_list_bulleted
Question

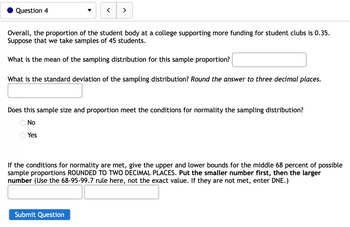
Transcribed Image Text:Question 4
>
Overall, the proportion of the student body at a college supporting more funding for student clubs is 0.35.
Suppose that we take samples of 45 students.
What is the mean of the sampling distribution for this sample proportion?
What is the standard deviation of the sampling distribution? Round the answer to three decimal places.
Does this sample size and proportion meet the conditions for normality the sampling distribution?
No
Yes
If the conditions for normality are met, give the upper and lower bounds for the middle 68 percent of possible
sample proportions ROUNDED TO TWO DECIMAL PLACES. Put the smaller number first, then the larger
number (Use the 68-95-99.7 rule here, not the exact value. If they are not met, enter DNE.)
Submit Question
Expert Solution
This question has been solved!
Explore an expertly crafted, step-by-step solution for a thorough understanding of key concepts.
Step by stepSolved in 4 steps with 4 images

Knowledge Booster
Similar questions
- Calories consumed by members of a track team the day before a race are normally distributed, with a mean of 1,800 calories and a standard deviation of 100 calories. If a normal curve is sketched using these data, what is the range for 3 standard deviations to the right and to the left of the mean? Group of answer choices 0–3,600 1,700–1,900 1,600–2,000 1,500–2,100arrow_forwardUse the Central Limit Theorem to find the mean and standard error of the mean of the sampling distribution. Then sketch a graph of the sampling distribution. The mean price of photo printers on a website is $227 with a standard deviation of $58. Random samples of size 22 are drawn from this population and the mean of each sample is determined. Question content area bottom Part 1 The mean of the distribution of sample means is enter your response here . Part 2 The standard deviation of the distribution of sample means is enter your response here . (Type an integer or decimal rounded to three decimal places as needed.) Part 3 Sketch a graph of the sampling distribution. Choose the correct answer below. A. 224 227 230Mean price (in $) x A bell shaped curve is over a horizontal x overbar axis labeled Mean price (in dollars) from 224 to 230 in increments of 1 and is centered on 227. B. -3 0 3Mean…arrow_forwardAn insurance company is looking over accident statistics. They want to model the population of all drivers for the population parameter of the standard deviation and variance of the age of the driver involved in an automobile accident. They have a sample of 100 accidents from around the country. The age of the driver in each of these accidents is provided below. Use Excel to calculate the sample standard deviation and the sample variance. Round your answers to one decimal place. Do not round until you've calculated your final answer "Age of people in accident"48643346436728189044472440202747683248472248217347302918487364454920205066654187873417203176493089672222455023481746382942254720463119214227226621236675744621461969202048238851284918204522313823284939 Standard deviation: Variance:arrow_forward
- Homework: Week 6 Sa Score: 0 of 1 pt 5 of 14 (4 complete) HW Score: 28.57%, 4 of 14 5.4.3 Question Help A population has a meanu= 80 and a standard deviation o = 21. Find the mean and standard deviation of a sampling distribution of sample means with sample size n= 232. (Simplify your answer.) In Enter your answer in the answer box and then click Check Answer. Check Answer Clear All 1 part remaining earcharrow_forwardA population of values has a normal distribution with 45.2 and a 67.7. You intend to draw a random sample of size n = 108. Please answer the following questions, and show your answers to 1 decimal place. Find the value separating the bottom 35% values from the top 65% values. Find the sample mean separating the bottpm 35% sample means from the top 65% sample means.arrow_forwardplease answer the question in the photo thank you :)arrow_forward
arrow_back_ios
arrow_forward_ios
Recommended textbooks for you
 MATLAB: An Introduction with ApplicationsStatisticsISBN:9781119256830Author:Amos GilatPublisher:John Wiley & Sons Inc
 Probability and Statistics for Engineering and th...StatisticsISBN:9781305251809Author:Jay L. DevorePublisher:Cengage Learning
 Statistics for The Behavioral Sciences (MindTap C...StatisticsISBN:9781305504912Author:Frederick J Gravetter, Larry B. WallnauPublisher:Cengage Learning
 Elementary Statistics: Picturing the World (7th E...StatisticsISBN:9780134683416Author:Ron Larson, Betsy FarberPublisher:PEARSON
 The Basic Practice of StatisticsStatisticsISBN:9781319042578Author:David S. Moore, William I. Notz, Michael A. FlignerPublisher:W. H. Freeman
 Introduction to the Practice of StatisticsStatisticsISBN:9781319013387Author:David S. Moore, George P. McCabe, Bruce A. CraigPublisher:W. H. Freeman

MATLAB: An Introduction with Applications
Statistics
ISBN:9781119256830
Author:Amos Gilat
Publisher:John Wiley & Sons Inc

Probability and Statistics for Engineering and th...
Statistics
ISBN:9781305251809
Author:Jay L. Devore
Publisher:Cengage Learning

Statistics for The Behavioral Sciences (MindTap C...
Statistics
ISBN:9781305504912
Author:Frederick J Gravetter, Larry B. Wallnau
Publisher:Cengage Learning

Elementary Statistics: Picturing the World (7th E...
Statistics
ISBN:9780134683416
Author:Ron Larson, Betsy Farber
Publisher:PEARSON

The Basic Practice of Statistics
Statistics
ISBN:9781319042578
Author:David S. Moore, William I. Notz, Michael A. Fligner
Publisher:W. H. Freeman

Introduction to the Practice of Statistics
Statistics
ISBN:9781319013387
Author:David S. Moore, George P. McCabe, Bruce A. Craig
Publisher:W. H. Freeman