
MATLAB: An Introduction with Applications
6th Edition
ISBN: 9781119256830
Author: Amos Gilat
Publisher: John Wiley & Sons Inc
expand_more
expand_more
format_list_bulleted
Related questions
Question
what is the critical t-stat for this test (alpha 0.01, one-tailed)?
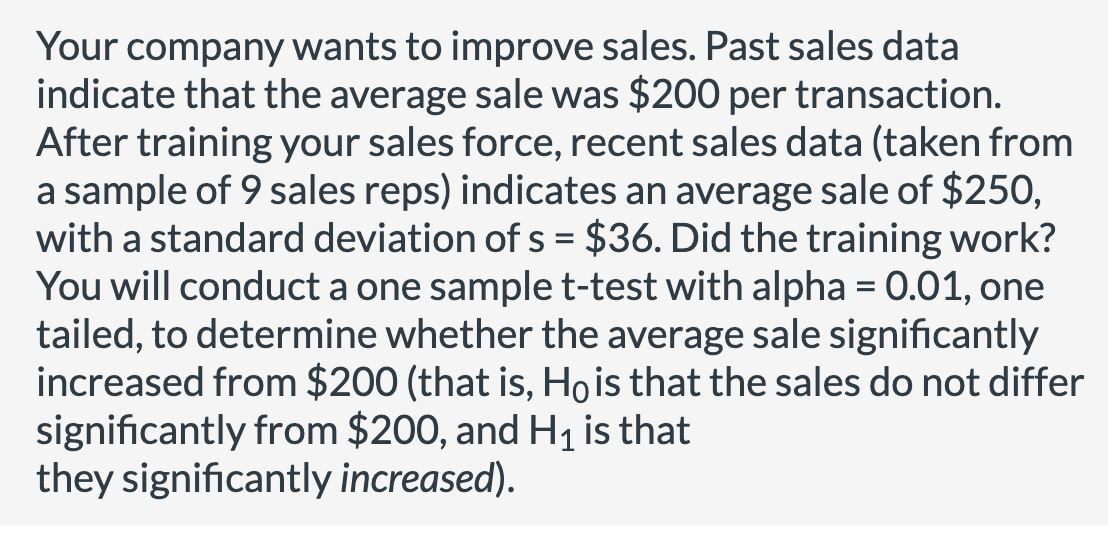

Transcribed Image Text:Your company wants to improve sales. Past sales data
indicate that the average sale was $200 per transaction.
After training your sales force, recent sales data (taken from
a sample of 9 sales reps) indicates an average sale of $250,
with a standard deviation of s = $36. Did the training work?
You will conduct a one sample t-test with alpha = 0.01, one
tailed, to determine whether the average sale significantly
increased from $200 (that is, Ho is that the sales do not differ
significantly from $200, and H₁ is that
they significantly increased).
Expert Solution
This question has been solved!
Explore an expertly crafted, step-by-step solution for a thorough understanding of key concepts.

This is a popular solution

Trending nowThis is a popular solution!

Step by stepSolved in 2 steps with 1 images

Knowledge Booster

Similar questions
- Currently patrons at the library speak at an average of 66 decibels. Will this average increase after the installation of a new computer plug in station? After the plug in station was built, the librarian randomly recorded 69 people speaking at the library. Their average decibel level was 67.7 and their standard deviation was 13. What can be concluded at the the αα = 0.10 level of significance? For this study, we should use Select an answer z-test for a population proportion t-test for a population mean The null and alternative hypotheses would be: H0:H0: ? μ p Select an answer ≠ = < > H1:H1: ? p μ Select an answer < ≠ = > The test statistic ? z t = (please show your answer to 3 decimal places.) The p-value = (Please show your answer to 4 decimal places.) The p-value is ? > ≤ αα Based on this, we should Select an answer fail to reject accept reject the null hypothesis. Thus, the final conclusion is that ... The data suggest the populaton…arrow_forward200 patients involves 200 particpants in comparing an experimental medication to a placebo. Each person enrolled is randomized to recieve either the experimental medication or placebo. Data is collected at the end of the study after 6 weeks. Test if there is significant difference in mean systolic blood pressures between grouos using a=0.05. Meqn of 174 standard deviation of 19.5 Mean systolic blood pressure: experimental (n= 100) 120.2 (15.4) placebo (100) 131.4 (18.9) Hypertensive (%) exp. 14 placebo 22 Side effects (%) exp. 6 placebo 8arrow_forwardWhere are the critical region(s) located in a z-distribution if a two-tailed hypothesis test was conducted using an alpha = 0.0892? Report the complete z-score (no rounding)arrow_forward
- A certain breed of rat shows a mean weight gain of 65g during the first 3 months of life. A random sample of 34 rats of this breed are fed a new diet from birth until age 3 months. These 34 rats have a mean weight gain of 60.75g and a standard deviation of 3.84g. We are interested in testing whether there is reason to believe, at the 0.05 significance level, that the new diet is causing a change in the average amount of weight gained in this breed of rats. By comparing the test statistic and the critical value, what conclusion can we draw at the 0.05 significance level? Since the test statistic is more extreme than the critical value, we reject the null hypothesis. We have statistically significant evidence to conclude that average weight gain during the first 3 months of a certain breed of rat's life on the new diet is not equal to 65g. Since the test statistic is NOT more extreme than the critical value, we fail to reject the null hypothesis. We do not have statistically significant…arrow_forwardWhat is the critical value of a one-tailed greater than One-Sample Z-Test for Mean where alpha equals 0.05?arrow_forwardIf we conduct a z-test and use the alpha level of p < .05 [and our test is 'non directional,' i.e, we consider values at both ends of the z-score distribution] the value that we calculate for the z-test has to fall inside to be considered rare enough to be statistically significant. 5% of the lower values (tail of the curve) or 5% of the upper values in the other tail of the curve. The middle 5% of the curve 2.5% of the lower values (tail of the curve) or 2.5% of the upper values in the other tail of the curve. The middle 95% of the curvearrow_forward
- What is the critical value at an alpha of .01 as a 1-tailed test, and based on its calculation what should the decision be? What is the possible error made? Was there an error?arrow_forwardRecently, a simple random sample of 572 adult males showed that 124 of them smoke. It has been established that in 2008. 20.4% of adults smoke. Use a 0.05 significance level to test the claim that the rate of smoking by adult males is now the same as in 2008. What is the value of the critical z tabular value?arrow_forwardBefore the furniture store began its ad campaign, it averaged 158 customers per day. The manager is investigating if the average is smaller since the ad came out. The data for the 11 randomly selected days since the ad campaign began is shown below: 147, 142, 149, 133, 146, 159, 132, 137, 148, 172, 150 Assuming that the distribution is normal, what can be concluded at the αα = 0.10 level of significance? For this study, we should use Select an answer z-test for a population proportion t-test for a population mean The null and alternative hypotheses would be: H0:H0: ? μ p Select an answer > ≠ < = H1:H1: ? p μ Select an answer < ≠ > = The test statistic ? z t = (please show your answer to 3 decimal places.) The p-value = (Please show your answer to 4 decimal places.) The p-value is ? ≤ > αα Based on this, we should Select an answer accept fail to reject reject the null hypothesis. Thus, the final conclusion is that ... The data suggest…arrow_forward
- According to the Oxnard College Student Success Committee report in the previous year, we believe that 17% of students struggle in their classes because they don't spend more than 8 hours studying independently outside of a 4-unit class. For this year, you would like to obtain a new sample to estimate the proportiton of all Oxnard students who struggle in their classes because they don't study enough outside of the classrooms. You would like to be 95% confident that your estimate is within 1% of the true population proportion. How large of a sample size is required? Do not round mid-calculation. n =arrow_forwardAn airline company is interested in improving customer satisfaction rate from the 66% currently claimed. The company sponsored a survey of 262 customers and found that 184 customers were satisfied. What is the test statistic z? What is the p-value? Does sufficient evidence exist that the customer satisfaction rate is higher than the claim by the company at a significance level of α=0.01 (Y/N)arrow_forwardTwenty-two young asthmatic volunteers were studied to assess the short-term effects of sulfur dioxide (SO2) exposure under various conditions [12]. The baseline data in Table 12.30 were presented regarding bronchial reactivity to SO2 stratified by lung function (as defined by forced expiratory volume / forced vital capacity [FEV1/FVC]) at screening. *12.6 Test the hypothesis that there is an overall mean difference in bronchial reactivity among the three lung-function groups. *12.7 Compare the means of each pair of groups using the LSD method. *12.8 Compare the means of each pair of groups using the Bonferroni method.arrow_forward
arrow_back_ios
arrow_forward_ios
Recommended textbooks for you
- MATLAB: An Introduction with ApplicationsStatisticsISBN:9781119256830Author:Amos GilatPublisher:John Wiley & Sons Inc
 Probability and Statistics for Engineering and th...StatisticsISBN:9781305251809Author:Jay L. DevorePublisher:Cengage Learning
 Statistics for The Behavioral Sciences (MindTap C...StatisticsISBN:9781305504912Author:Frederick J Gravetter, Larry B. WallnauPublisher:Cengage Learning
  Elementary Statistics: Picturing the World (7th E...StatisticsISBN:9780134683416Author:Ron Larson, Betsy FarberPublisher:PEARSON
 The Basic Practice of StatisticsStatisticsISBN:9781319042578Author:David S. Moore, William I. Notz, Michael A. FlignerPublisher:W. H. Freeman
 Introduction to the Practice of StatisticsStatisticsISBN:9781319013387Author:David S. Moore, George P. McCabe, Bruce A. CraigPublisher:W. H. Freeman
MATLAB: An Introduction with Applications
Statistics
ISBN:9781119256830
Author:Amos Gilat
Publisher:John Wiley & Sons Inc
Probability and Statistics for Engineering and th...
Statistics
ISBN:9781305251809
Author:Jay L. Devore
Publisher:Cengage Learning
Statistics for The Behavioral Sciences (MindTap C...
Statistics
ISBN:9781305504912
Author:Frederick J Gravetter, Larry B. Wallnau
Publisher:Cengage Learning
Elementary Statistics: Picturing the World (7th E...
Statistics
ISBN:9780134683416
Author:Ron Larson, Betsy Farber
Publisher:PEARSON
The Basic Practice of Statistics
Statistics
ISBN:9781319042578
Author:David S. Moore, William I. Notz, Michael A. Fligner
Publisher:W. H. Freeman
Introduction to the Practice of Statistics
Statistics
ISBN:9781319013387
Author:David S. Moore, George P. McCabe, Bruce A. Craig
Publisher:W. H. Freeman