
MATLAB: An Introduction with Applications
6th Edition
ISBN: 9781119256830
Author: Amos Gilat
Publisher: John Wiley & Sons Inc
expand_more
expand_more
format_list_bulleted
Related questions
Question
Activity1: Formulate the null and alternative hypotheses. Identify whether it is one-tailed or two tailed. If the hypothesis is one-tailed, identify its direction whether left or right. Write your answer on a separate sheet of paper.
Note: You need to provide 3 answers (null hypothesis, alternative hypothesis, and ___-tailed test) for each question.
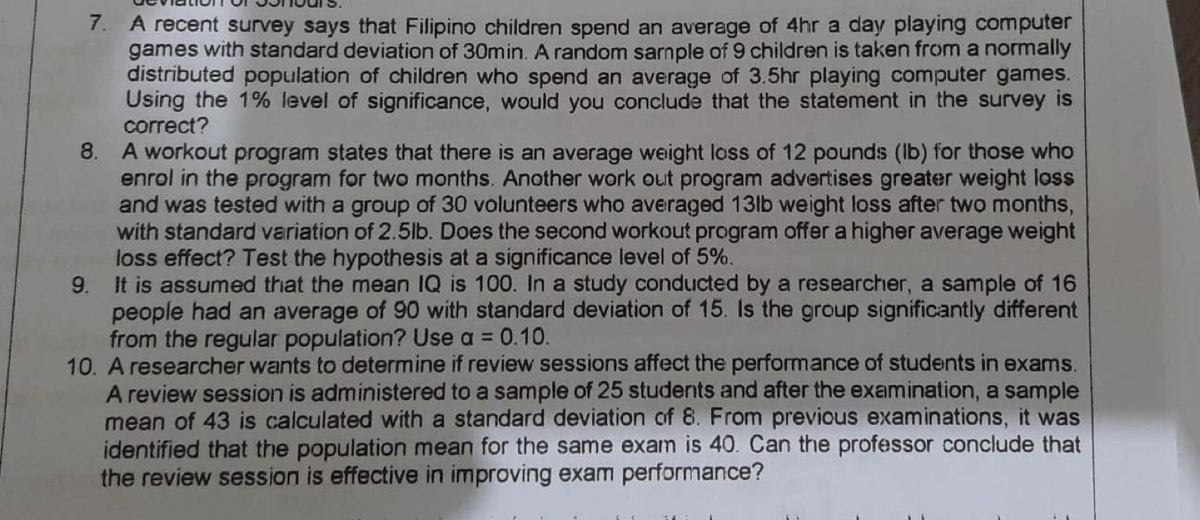

Transcribed Image Text:7. A recent survey says that Filipino children spend an average of 4hr a day playing computer
games with standard deviation of 30min. A random sarnple of 9 children is taken from a normally
distributed population of children who spend an average of 3.5hr playing computer games.
Using the 1% level of significance, would you conclude that the statement in the survey is
correct?
8. A workout program states that there is an average weight loss of 12 pounds (lb) for those who
enrol in the program for two months. Another work out program advertises greater weight loss
and was tested with a group of 30 volunteers who averaged 13lb weight loss after two months,
with standard variation of 2.5lb. Does the second workout program offer a higher average weight
loss effect? Test the hypothesis at a significance level of 5%.
9. It is assumed that the mean IQ is 100. In a study conducted by a researcher, a sample of 16
people had an average of 90 with standard deviation of 15. Is the group significantly different
from the regular population? Use a = 0.10.
10. A researcher wants to determine if review sessions affect the performance of students in exams.
A review session is administered to a sample of 25 students and after the examination, a sample
mean of 43 is calculated with a standard deviation of 8. From previous examinations, it was
identified that the population mean for the same exam is 40. Can the professor conclude that
the review session is effective in improving exam performance?
Expert Solution
This question has been solved!
Explore an expertly crafted, step-by-step solution for a thorough understanding of key concepts.

Step by stepSolved in 4 steps

Knowledge Booster

Similar questions
- What are the null and alternative hypotheses? A. H0: The two variables, x and y, are associated. Ha: The two variables, x and y, are not associated. B. H0: The variable x is dependent upon y. Ha: The variable y is dependent upon x. C. H0: The two variables, x and y, are not associated. Ha: The two variables, x and y, are associated. The P-value is (Round to three decimal places as needed.) What is the conclusion of the independence test? A. Do not reject H0. The data provide sufficient evidence of an association. B. Reject H0. The data provide sufficient evidence of an association. C. Do not reject H0. The data do not provide sufficient evidence of an association. D. Reject H0. The data do not provide sufficient evidence of an association.arrow_forwardWhich hypothesis represents the statement of "no change" (or "no affect/difference"), that we assume to be true? A.The one hypothesis, H1 B.The null hypothesis, H0 C.The right hypothesis, H0 D.The alternative Hypothesis, H1arrow_forwardSolvearrow_forward
- The following table contains the number of successes and failures for three categories of a variable. Test whether the proportions are equal for each category at the α=0.1 level of significance. Category 1 Category 2 Category 3 Failures 32 51 57 Successes 39 54 73 State the hypotheses. Choose the correct answer below. A. H0: The categories of the variable and success and failure are independent. H1: The categories of the variable and success and failure are dependent. B. H0: The categories of the variable and success and failure are dependent. H1: The categories of the variable and success and failure are independent. C. H0: p1=p2=p3 H1: At least one of the proportions is different from the others. D. H0: μ1=E1 and μ2=E2 and μ3=E3 H1: At least one mean is different from what is expected. What is the P-value? nothing (Round to three decimal places as needed.) What conclusion can be…arrow_forwardA decade-old study found that the proportion of high school seniors who felt that "getting rich" was an important personal goal was 66%. Suppose that we have reason to believe that this proportion has changed, and we wish to carry out a hypothesis test to see if our belief can be supported. State the null hypothesis H 00 and the alternative hypothesis H, that we would use for this test. H, :0 H, :0arrow_forwardWhen using the 4 step hypothesis testing method, the alternative hypothesis __________? a. is symbolized by: H1 b. is symbolized by: H0 c. states that the two population means are equal d. must be directional in nature (must be a one tailed test)arrow_forward
- Perform a hypothesis test at a 5% level of significance to see if the proportion of white individuals who are fatally shot by police is less than the total proportion of white individuals in the United States, which is approximately 60.1% according to the U.S. census bureau. State your null and alternative hypotheses in mathematical notationarrow_forwardAnswer Darrow_forwardA sociologist wants to study what proportion of people have significant relationship problems due to financial stress. A previous study she is aware of estimated it to be 32% but she believes this has increased in modern times. She collects a random sample of 150 people and 63 of them report relationship problems due to financial stress. Conduct an appropriate hypothesis test in questions #22-#25. Compute the Z-score for this hypothesis test and round to two decimal places. z = 1.58 z = 2.06 z = 2.63 z = 0.84arrow_forward
- View the information below and respond accordingly. When you perform a hypothesis test, there are four possible outcomes depending on the actual truth (or falseness) of the null hypothesis H0 and the decision to reject or not. The outcomes are summarized in the following table: Table 9.2 ACTION H0 IS ACTUALLY True H0 IS ACTUALLY False Do not reject H0 Correct Outcome Type II error Reject H0 Type I Error Correct Outcomearrow_forwardRobert, a starting player for a major college basketball team, made only 38.4% of his free-throws in previous seasons. During the summer, he worked on developing a softer shot in hopes of improving his free throw accuracy. In the first eight games of the season, Robert made 25 free throws of 40 (or 62.5%). We wish to test if the practice helped. Which of the following are the appropriate null and alternative hypotheses, letting p denote his new free-throw shooting probability The null hypothesis is H0: ["", "", "", ""] The alternative hypothesis is Ha:arrow_forwardA study found that 13% of Americans have seen or sensed the presence of an angel. A contingent doubts that the percent is really that high. It conducts its own survey. Out of 76 Americans surveyed, only two had seen or sensed the presence of an angel. As a result of the contingent's survey, would you agree with the study? Will you reject the null hypothesis or not?arrow_forward
arrow_back_ios
SEE MORE QUESTIONS
arrow_forward_ios
Recommended textbooks for you
- MATLAB: An Introduction with ApplicationsStatisticsISBN:9781119256830Author:Amos GilatPublisher:John Wiley & Sons Inc
 Probability and Statistics for Engineering and th...StatisticsISBN:9781305251809Author:Jay L. DevorePublisher:Cengage Learning
 Statistics for The Behavioral Sciences (MindTap C...StatisticsISBN:9781305504912Author:Frederick J Gravetter, Larry B. WallnauPublisher:Cengage Learning
  Elementary Statistics: Picturing the World (7th E...StatisticsISBN:9780134683416Author:Ron Larson, Betsy FarberPublisher:PEARSON
 The Basic Practice of StatisticsStatisticsISBN:9781319042578Author:David S. Moore, William I. Notz, Michael A. FlignerPublisher:W. H. Freeman
 Introduction to the Practice of StatisticsStatisticsISBN:9781319013387Author:David S. Moore, George P. McCabe, Bruce A. CraigPublisher:W. H. Freeman
MATLAB: An Introduction with Applications
Statistics
ISBN:9781119256830
Author:Amos Gilat
Publisher:John Wiley & Sons Inc
Probability and Statistics for Engineering and th...
Statistics
ISBN:9781305251809
Author:Jay L. Devore
Publisher:Cengage Learning
Statistics for The Behavioral Sciences (MindTap C...
Statistics
ISBN:9781305504912
Author:Frederick J Gravetter, Larry B. Wallnau
Publisher:Cengage Learning
Elementary Statistics: Picturing the World (7th E...
Statistics
ISBN:9780134683416
Author:Ron Larson, Betsy Farber
Publisher:PEARSON
The Basic Practice of Statistics
Statistics
ISBN:9781319042578
Author:David S. Moore, William I. Notz, Michael A. Fligner
Publisher:W. H. Freeman
Introduction to the Practice of Statistics
Statistics
ISBN:9781319013387
Author:David S. Moore, George P. McCabe, Bruce A. Craig
Publisher:W. H. Freeman