
MATLAB: An Introduction with Applications
6th Edition
ISBN: 9781119256830
Author: Amos Gilat
Publisher: John Wiley & Sons Inc
expand_more
expand_more
format_list_bulleted
Related questions
Question
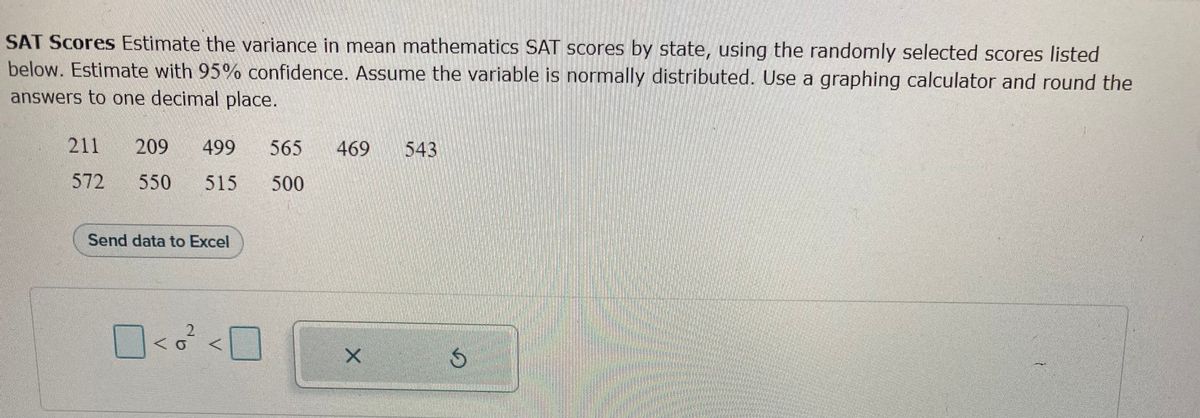

Transcribed Image Text:SAT Scores Estimate the variance in mean mathematics SAT scores by state, using the randomly selected scores listed
below. Estimate with 95% confidence. Assume the variable is normally distributed. Use a graphing calculator and round the
answers to one decimal place.
211 209 499 565 469
572
550 515 500
Send data to Excel
<<0² <0
X
543
S
Expert Solution
This question has been solved!
Explore an expertly crafted, step-by-step solution for a thorough understanding of key concepts.

Step by stepSolved in 4 steps with 4 images

Knowledge Booster

Similar questions
- Earnings of Nonliving Celebrities Forbes magazine prints an annual Top-Earning Nonliving Celebrities list (based on royalties and estate earnings). Find the mean, median, mode, and midrange for the data. Comment on the skewness. Figures represent millions of dollars. Rodgers & Hammerstein 235 John Lennon 15 Michael Jackson 90 Dr. Seuss 15 Elvis Presley 55 Albert Einstein 10 JRR Tolkien 50 Michael Crichton 9. Charles Schulz 35 Jimi Hendrix 8 Send data to Excel Part: 0 / 5 Part 1 of 5 Find the mean. Rounding rule for the mean: round to one more decimal place than the data as needed. Mean:arrow_forwardB 4 points A researcher collects data from four groups that each have 5 different individuals. The sum of square within group was calculated to be 162.40 and the mean squares within value was 10.15. How many degrees of freedom are there? Type your answer... DOarrow_forwardFind the mean, the median, and the mode(s), if any, for the given data. Round noninteger means to the nearest tenth. (If there is more than one mode, enter your answer as a comma-separated list. If an answer does not exist, enter DNE.) −8.5, −2.4, 4.7, 4.7, 6.4, 8.9, 9.9arrow_forward
- Derby collects samples of insects in the forest and in a marsh to count the number of insects in each sample and then releases the insects. The number of insects in each sample from the two locations is provided below. Forest 1515 1313 1414 99 1616 1111 1515 1414 1515 1414 Marsh 1717 1414 1515 1717 1616 1818 1717 1919 1313 1616 What is the median and the interquartile range for each of the two locations? Round to one decimal place. The median number of insects in the forest samples is , and the interquartile range is . The median number of insects in the marsh samples is , and the interquartile range is .arrow_forwardThe top 16 winning scores for NFL games are listed below. Find the mean score. Video Tutorial: How to find the mean on a TI-84 72 54 52 54 70 51 56 58 58 52 51 63 51 48 52 61 A. 54 B. 57.1 C. 63.2 D. 56.4arrow_forwardResearchers wondered whether the size of a person's brain was related to the individual's mental capacity. They selected a sample of 5 females and 5 males and measured their MRI image pixel counts and IQ scores. Females Males MRI IQ MRI IG The data is reported to the right. Complete parts (a) through (d) below 139 858,472 140 955,003 935,494 924,059 1.079.550 1,001.121 Click the icon to view the critical values table. 991,305 138 141 857,782 833,868 790,619 133 135 132 141 135 140 AMRI 1,080,000- AIO 145 AIO 145- AMRI 1,080,000 780,000 130 130 780,000 130 780,000 780,000 130 1,080,000 145 1,080,000 MRI 145 MRI (b) Compute the linear correlation coefficient between MRI count and IQ. Are MRI count and IQ linearly related? Select the correct choice below and, if necessary, fill in the answer box to complete your choice. (Round to three decimal places as needed.) A. Yes, MRI count and IQ are linearly related since the linear correlation coefficient is O B. No. MRI count and IQ are not…arrow_forward
- The histogram describes the height of students in a math class. Is the data univariate or bivariate? Is the skewness left, right, or normal?arrow_forwardDoes Hypnotism Relieve Pain? The table shows the pain levels of patients before and after hypnotism. Pain level is measured on a cm scale. Assume that the two samples are randomly selected. At the 0.05 significance level, test the claim that the mean difference has increased after hypnotism.(Be sure to subtract in the same direction).arrow_forwardA sample of the lifetime of an electrical component is given bellow, in number of hours: 123, 116, 122, 110, 210, 126, 125, 111, 118, 117 Calculate the sample mean and sample median for these lifetimes. Sample Mean 127.8 Sample Median 120 Can you explain why these two measures of location are so different? Submit Questionarrow_forward
- For computing the variance this number is called as the value that is added or subtracted from the most probable value a. accuracy b. mistake c. error d. probable errorarrow_forwardOne way analysis of variance is used to test for O A. equality of three or more population means O B. equality of three or more sample means OC. equality of three or more population proportions D. equality of three of more population variances Click to select your answer.arrow_forward
arrow_back_ios
arrow_forward_ios
Recommended textbooks for you
- MATLAB: An Introduction with ApplicationsStatisticsISBN:9781119256830Author:Amos GilatPublisher:John Wiley & Sons Inc
 Probability and Statistics for Engineering and th...StatisticsISBN:9781305251809Author:Jay L. DevorePublisher:Cengage Learning
 Statistics for The Behavioral Sciences (MindTap C...StatisticsISBN:9781305504912Author:Frederick J Gravetter, Larry B. WallnauPublisher:Cengage Learning
  Elementary Statistics: Picturing the World (7th E...StatisticsISBN:9780134683416Author:Ron Larson, Betsy FarberPublisher:PEARSON
 The Basic Practice of StatisticsStatisticsISBN:9781319042578Author:David S. Moore, William I. Notz, Michael A. FlignerPublisher:W. H. Freeman
 Introduction to the Practice of StatisticsStatisticsISBN:9781319013387Author:David S. Moore, George P. McCabe, Bruce A. CraigPublisher:W. H. Freeman
MATLAB: An Introduction with Applications
Statistics
ISBN:9781119256830
Author:Amos Gilat
Publisher:John Wiley & Sons Inc
Probability and Statistics for Engineering and th...
Statistics
ISBN:9781305251809
Author:Jay L. Devore
Publisher:Cengage Learning
Statistics for The Behavioral Sciences (MindTap C...
Statistics
ISBN:9781305504912
Author:Frederick J Gravetter, Larry B. Wallnau
Publisher:Cengage Learning
Elementary Statistics: Picturing the World (7th E...
Statistics
ISBN:9780134683416
Author:Ron Larson, Betsy Farber
Publisher:PEARSON
The Basic Practice of Statistics
Statistics
ISBN:9781319042578
Author:David S. Moore, William I. Notz, Michael A. Fligner
Publisher:W. H. Freeman
Introduction to the Practice of Statistics
Statistics
ISBN:9781319013387
Author:David S. Moore, George P. McCabe, Bruce A. Craig
Publisher:W. H. Freeman