
MATLAB: An Introduction with Applications
6th Edition
ISBN: 9781119256830
Author: Amos Gilat
Publisher: John Wiley & Sons Inc
expand_more
expand_more
format_list_bulleted
Related questions
Question
The following tables show five people’s occupational prestige scores (OPS) and their income (in thousand dollars), and the
Calculate the intercept (or the constant) of the regression line with TWO decimal digits.
A. 52.16
B. 39.84
C. 58.88
D. 33.12
E. 89.68
F. 2.32
G. 133.36
H. -41.36
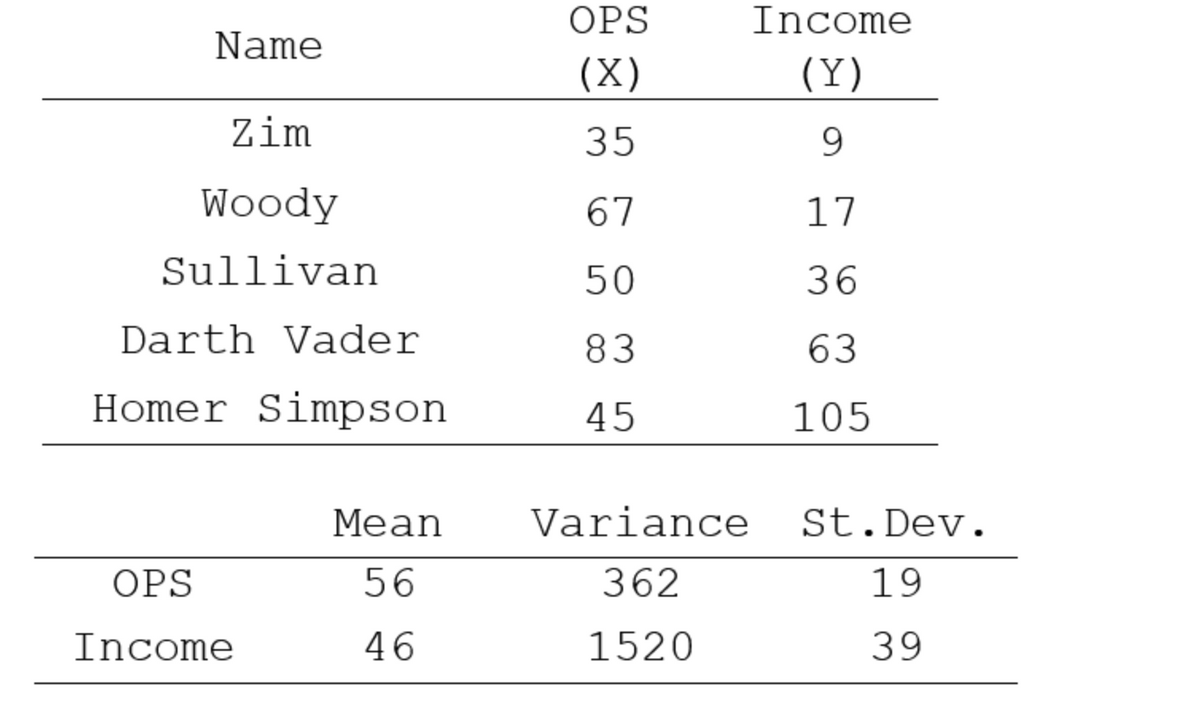

Transcribed Image Text:OPS
Income
Name
(X)
(Y)
Zim
35
9
Woody
67
17
Sullivan
50
36
Darth Vader
83
63
Homer Simpson
45
105
Mean
Variance
St.Dev.
OPS
56
362
19
Income
46
1520
39
Expert Solution
This question has been solved!
Explore an expertly crafted, step-by-step solution for a thorough understanding of key concepts.

Step by stepSolved in 2 steps with 1 images

Knowledge Booster

Similar questions
- Instructions: The following is the recorded earthquakes on South Carolina from August, 2016 to February, 2017. Use the data to find the residuals. Then draw a residual plot by hand. Use the residual plot to determine if the linear model is the best regression model for this data. Magnitude Depth (km.) 1.7 2.9 1.1 0.8 1.4 1.9 0.7 3.2 0.8 4.3 1.9 4 1.7 6.3 1.9 6.9 1.9 0.9 | 1.1 Source: USGS Residual (Round to nearest tenth) 1.7 -2.2 1.1 -1.8 1.4 -2.0 0.7 -2.2arrow_forwardFor the data below find a simple linear regression equation that relates the Advertising cost to the Sales. : SALES (S1,000) ADVERTISING (S100) 11 6. 3 10 2. 12 Also find the correlation coefficient (r) and the values of SST, SSE, and SSR. What is the predicte value for the sales if the advertisements were 10 (in $100)?arrow_forwardA baseball team claims that the mean length of its games is 2.4 hours. State H0 and Ha in words and in symbols. Then determine whether the hypothesis test for this claim is left-tailed, right-tailed, or two-tailed. Explain your reasoning. State the null hypothesis in words and in symbols. Choose the correct answer below. A. The null hypothesis expressed in words is, "the mean length of a baseball team's games is at most 2.4 hours." The null hypothesis is expressed symbolically as, "H0: μ≤2.4." B. The null hypothesis expressed in words is, "the mean length of a baseball team's games is more than 2.4 hours." The null hypothesis is expressed symbolically as, "H0: μ≠2.4." C. The null hypothesis expressed in words is, "the mean length of a baseball team's games is at least 2.4 hours." The null hypothesis is expressed symbolically as, "H0: μ≥2.4." D. The null hypothesis expressed in words is, "the mean length of a baseball…arrow_forward
- Graph the scatterplot and find the equation of the regression line GDP. CO2 emissions (in millions metric tons) 1.7. 552.6 1.2. 462.3 2.5. 475.4 2.8. 374.3 3.6. 748.5 2.2. 400.9 0.8. 253.0 1.5. 318.6 2.4. 496.8 5.9. 1180.6arrow_forwardUse the following information to answer the question. The following linear regression model can be used to predict ticket sales at a popular water park. Ticket sales per hour = -631.25 + 11.25(current temperature in °F) What is the predicted number of tickets sold per hour if the temperature is 86°F? Round to the nearest whole ticket. O About 336 tickets O About 252 tickets O About 276 tickets About 301 ticketsarrow_forwardHere is data with y as the response variable. a. Make a scatter plot of this data. Which point is an outlier? Enter as an ordered pair, e.g., (x,y). (x, y) b. Find the regression equation for the data set without the outlier. Enter the equation of the form mx + b rounded three decimal places. y wo X 48.4 77.3 88 67.1 108.3 75.9 64.8 -161.3 61.2 67.9 ŷw y 45.7 40.3 27.3 54.5 -63.2 36.3 73.2 96.5 82.2 119.8 = -- c. Find the regression equation for the data set with the outlier. Enter the equation of the form mx + b rounded to three decimal places.arrow_forward
- You may need to use the appropriate technology to answer this question. Consider the following data on price ($) and the overall score for six stereo headphones tested by a certain magazine. The overall score is based on sound quality and effectiveness of ambient noise reduction. Scores range from 0 (lowest) to 100 (highest). Brand Price($) Score A 180 74 B 150 69 C 95 61 D 70 56 E 70 42 F 35 28 (a) The estimated regression equation for this data is ŷ = 26.204 + 0.288x, where x = price ($) and y = overall score. Find the value of the test statistic. (Round your answer to three decimal places.) Find the p-value. (Round your answer to four decimal places.) (b) Test for a significant relationship using the F test. Use α = 0.05 Find the value of the test statistic. (Round your answer to two decimal places.) (c) Show the ANOVA table for these data. (Round your p-value to three decimal places and all other values to two decimal places.) Find the…arrow_forwardPlease help me. Thankyou.arrow_forward
arrow_back_ios
arrow_forward_ios
Recommended textbooks for you
- MATLAB: An Introduction with ApplicationsStatisticsISBN:9781119256830Author:Amos GilatPublisher:John Wiley & Sons Inc
 Probability and Statistics for Engineering and th...StatisticsISBN:9781305251809Author:Jay L. DevorePublisher:Cengage Learning
 Statistics for The Behavioral Sciences (MindTap C...StatisticsISBN:9781305504912Author:Frederick J Gravetter, Larry B. WallnauPublisher:Cengage Learning
  Elementary Statistics: Picturing the World (7th E...StatisticsISBN:9780134683416Author:Ron Larson, Betsy FarberPublisher:PEARSON
 The Basic Practice of StatisticsStatisticsISBN:9781319042578Author:David S. Moore, William I. Notz, Michael A. FlignerPublisher:W. H. Freeman
 Introduction to the Practice of StatisticsStatisticsISBN:9781319013387Author:David S. Moore, George P. McCabe, Bruce A. CraigPublisher:W. H. Freeman
MATLAB: An Introduction with Applications
Statistics
ISBN:9781119256830
Author:Amos Gilat
Publisher:John Wiley & Sons Inc
Probability and Statistics for Engineering and th...
Statistics
ISBN:9781305251809
Author:Jay L. Devore
Publisher:Cengage Learning
Statistics for The Behavioral Sciences (MindTap C...
Statistics
ISBN:9781305504912
Author:Frederick J Gravetter, Larry B. Wallnau
Publisher:Cengage Learning
Elementary Statistics: Picturing the World (7th E...
Statistics
ISBN:9780134683416
Author:Ron Larson, Betsy Farber
Publisher:PEARSON
The Basic Practice of Statistics
Statistics
ISBN:9781319042578
Author:David S. Moore, William I. Notz, Michael A. Fligner
Publisher:W. H. Freeman
Introduction to the Practice of Statistics
Statistics
ISBN:9781319013387
Author:David S. Moore, George P. McCabe, Bruce A. Craig
Publisher:W. H. Freeman