MATLAB: An Introduction with Applications
6th Edition
ISBN: 9781119256830
Author: Amos Gilat
Publisher: John Wiley & Sons Inc
expand_more
expand_more
format_list_bulleted
Question

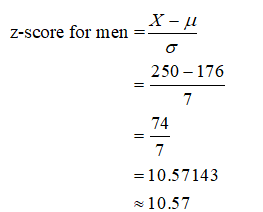
Transcribed Image Text:One of the tallest living men has a height of 250 cm. One of the tallest living women is 232 cm tall. Heights of men have a mean of 176 cm and a standard deviation of 7 cm Heights of women have a
mean of 159 cm and a standard deviation of 3 cm. Relative to the population of the same gender, who is taller? Explain.
Choose the correct answer below.
O A. The woman is relatively taller because the z score for her height is greater than the z score for the man's height.
O B. The woman is relatively taller because the z score for her height is less than thez score for the man's height.
O C. The man is relatively taller because the z score for his height is less than the z score for the woman's height.
O D. The man is relatively taller because the z score for his height is greater than the z score for the woman's height.
Expert Solution
arrow_forward
Step 1
Given that,
The z-score for men is,

Trending nowThis is a popular solution!
Step by stepSolved in 2 steps with 2 images

Knowledge Booster
Similar questions
- The average chef at a restaurant earns $17 an hour with a deviation of $1.75. What are the chances that someone is earning more than $20 an hour?arrow_forwardResearchers measured the data speeds for a particular smartphone carrier at 50 airports. The highest speed measured was 77.977.9 Mbps. The complete list of 50 data speeds has a mean of x overbarxequals=17.5417.54 Mbps and a standard deviation of sequals=18.9718.97 Mbps. a. What is the difference between carrier's highest data speed and the mean of all 50 data speeds? b. How many standard deviations is that [the difference found in part (a)]? c. Convert the carrier's highest data speed to a z score. d. If we consider data speeds that convert to z scores between minus−2 and 2 to be neither significantly low nor significantly high, is the carrier's highest data speed significant?arrow_forwardplease solve : B, C, and D ch 9arrow_forward
- Please answer B, C, & D.arrow_forwardPlz explain. Tyarrow_forwardAs a group, the Dutch are among the tallest people in the world. The average Dutch man is 184 cm tall - just over 6 feet. The standard deviation of men's height is about 8 cm. Assuming the distribution is approximately Normal, what fraction of Dutch men should be between 170 cm and 180 cm? type your answer... %arrow_forward
- i need helparrow_forwardA student scores 74 on a geography test and 264 on a mathematics test. The geography test has a mean of 80 and a standard deviation of 5. The mathematics test has a mean of 300 and a standard deviation of 24. If the data for both tests are normally distributed, on which test did the student score better relative to the other students in each class? OA. The student scored better on the mathematics test. OB. The student scored better on the geography test. OC. The student scored the same on both tests.arrow_forwardThe Acme Company manufactures widgets. The distribution of widget weights is bell shaped. The widget have a mean of 40 ounces and a standard deviation of 10 ounces. What percentage of the widget weights lie between 20 and 70 ounces?arrow_forward
- Help please.arrow_forwardThe GMAC Insurance company reported that the mean score on the National Drivers Test was 77.8 with a standard deviation of 2.5 points. The test scores are approximately bell-shaped. Approximately 68% of all test scores were between two values A and B. What is the value of A? Write only a number as your answer. Round to one decimal place.arrow_forwardUse the data 2, 3, 3, 6, 6, 7. Add 3 to each of the numbers. How does this affect the mean? How does this affect the standard deviation? Choose the correct answer below. .……. OA. Both of the mean and the standard deviation will be increased. OB. The standard deviation will be increased by 3, and the mean will remain the same. OC. Both of the mean and the standard deviation will remain the same. O D. The mean will be increased by 3, and the standard deviation will remain the same.arrow_forward
arrow_back_ios
SEE MORE QUESTIONS
arrow_forward_ios
Recommended textbooks for you
 MATLAB: An Introduction with ApplicationsStatisticsISBN:9781119256830Author:Amos GilatPublisher:John Wiley & Sons Inc
 Probability and Statistics for Engineering and th...StatisticsISBN:9781305251809Author:Jay L. DevorePublisher:Cengage Learning
 Statistics for The Behavioral Sciences (MindTap C...StatisticsISBN:9781305504912Author:Frederick J Gravetter, Larry B. WallnauPublisher:Cengage Learning
 Elementary Statistics: Picturing the World (7th E...StatisticsISBN:9780134683416Author:Ron Larson, Betsy FarberPublisher:PEARSON
 The Basic Practice of StatisticsStatisticsISBN:9781319042578Author:David S. Moore, William I. Notz, Michael A. FlignerPublisher:W. H. Freeman
 Introduction to the Practice of StatisticsStatisticsISBN:9781319013387Author:David S. Moore, George P. McCabe, Bruce A. CraigPublisher:W. H. Freeman

MATLAB: An Introduction with Applications
Statistics
ISBN:9781119256830
Author:Amos Gilat
Publisher:John Wiley & Sons Inc

Probability and Statistics for Engineering and th...
Statistics
ISBN:9781305251809
Author:Jay L. Devore
Publisher:Cengage Learning

Statistics for The Behavioral Sciences (MindTap C...
Statistics
ISBN:9781305504912
Author:Frederick J Gravetter, Larry B. Wallnau
Publisher:Cengage Learning

Elementary Statistics: Picturing the World (7th E...
Statistics
ISBN:9780134683416
Author:Ron Larson, Betsy Farber
Publisher:PEARSON

The Basic Practice of Statistics
Statistics
ISBN:9781319042578
Author:David S. Moore, William I. Notz, Michael A. Fligner
Publisher:W. H. Freeman

Introduction to the Practice of Statistics
Statistics
ISBN:9781319013387
Author:David S. Moore, George P. McCabe, Bruce A. Craig
Publisher:W. H. Freeman