
MATLAB: An Introduction with Applications
6th Edition
ISBN: 9781119256830
Author: Amos Gilat
Publisher: John Wiley & Sons Inc
expand_more
expand_more
format_list_bulleted
Related questions
Topic Video
Question
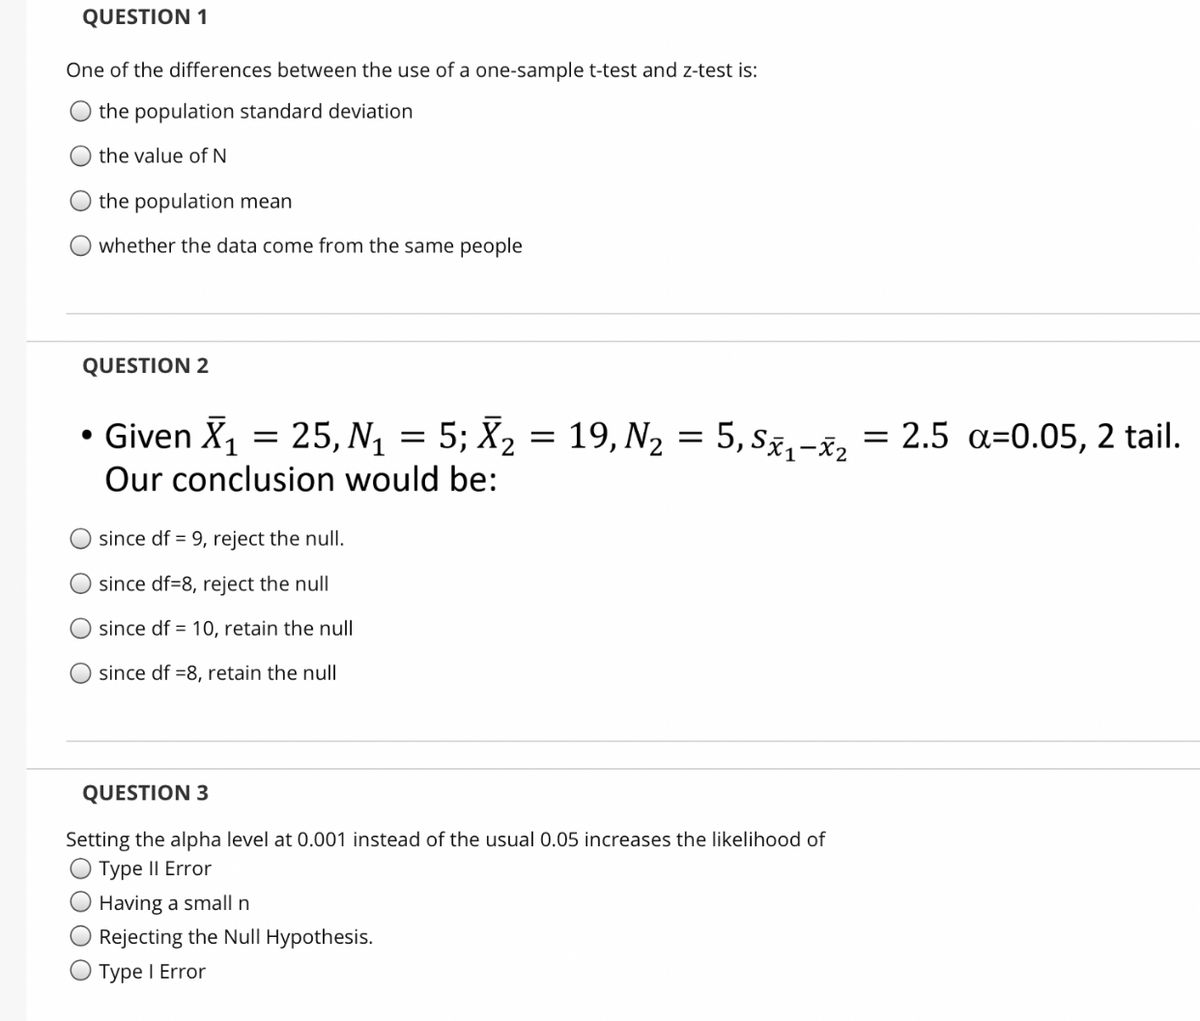

Transcribed Image Text:QUESTION 1
One of the differences between the use of a one-sample t-test and z-test is:
the population standard deviation
the value of N
the population mean
whether the data come from the same people
QUESTION 2
• Given X, = 25, N, = 5; X2 = 19, N2 = 5, sz, -i, = 2.5 a=0.05, 2 tail.
Our conclusion would be:
since df = 9, reject the null.
since df=8, reject the null
since df = 10, retain the null
since df =8, retain the null
QUESTION 3
Setting the alpha level at 0.001 instead of the usual 0.05 increases the likelihood of
O Type II Error
Having a small n
Rejecting the Null Hypothesis.
O Type I Error
Expert Solution
This question has been solved!
Explore an expertly crafted, step-by-step solution for a thorough understanding of key concepts.

Step by stepSolved in 2 steps

Knowledge Booster


Learn more about
Need a deep-dive on the concept behind this application? Look no further. Learn more about this topic, statistics and related others by exploring similar questions and additional content below.Similar questions
- (c) Determine if the means of samples 1 and 2 overestimate, underestimate, or are equal to the population mean. The mean pulse rate of sample 1 the population mean. The mean pulse rate of sample 2 the population mean.arrow_forwardHomework: Week 6 Sa Score: 0 of 1 pt 5 of 14 (4 complete) HW Score: 28.57%, 4 of 14 5.4.3 Question Help A population has a meanu= 80 and a standard deviation o = 21. Find the mean and standard deviation of a sampling distribution of sample means with sample size n= 232. (Simplify your answer.) In Enter your answer in the answer box and then click Check Answer. Check Answer Clear All 1 part remaining earcharrow_forwardWe would like to investigate if there is a difference in mean coffee consumption frequency between students at Rutgers, Princeton, and the University of Michigan. What test would we likely conduct? Independent samples t-test One Sample z-test Paired samples t-test One Way ANOVAarrow_forward
- urgentarrow_forwardYou want to compare differences in prior arrests across ethnicity in your study, you measured ethnicity as white =0 black =1 hispanic=2, and other =3. Prior arrests was recorded as the number of prior arrests. which test would you perform to see if arrests differ across diffrent ethnic categories? A. ANOVA B. T-testarrow_forwardWe want to determine if the percent of home runs hit by left-handed batters is greater than that of right-handed batters. What type of test should be used? OTwo sample z-test OTwo sample t-test O Single sample z-test Single sample t-testarrow_forward
- Consider the following data: −10, −10, 0, 3, −10, 3, 3 Step 1 of 3: Calculate the value of the sample Variance. Round your answer to one decimal place. Step 2 of 3: Calculate the value of the sample deviation. Round your answer to one decimal place. Step 3 of 3: Calculate the value of the range.arrow_forwardThe coefficient of variation CV describes the standard deviation as a percent of the mean. Because it has no units, you can use the coefficient of variation to compare data with different units. Find the coefficient of variation for each sample data set. What can you conclude? Heights Weights77 19379 20569 22379 22077 22572 17965 20173 21071 19670 20475 21379 209 CV heights= % CV weights = % what can you conclude?arrow_forwardThe histogram below shows the ages (in years) of Honda Civic automobiles listed for sale on the Seattle Times Web site on November 26, 2003. 20 15 10 2 4 6 8 10 12 14 16 18 Age (years) Which of the following terms apply to this histogram? (Select all that apply.) O negatively skewed(to the left) O uniform O symmetric O bimodal O unimodal O positively skewed(to the right) Which measure of center is most appropriate for this data? O median O mean Which measure of spread is most appropriate for this data? O standard deviation M # of carsarrow_forward
arrow_back_ios
arrow_forward_ios
Recommended textbooks for you
- MATLAB: An Introduction with ApplicationsStatisticsISBN:9781119256830Author:Amos GilatPublisher:John Wiley & Sons Inc
 Probability and Statistics for Engineering and th...StatisticsISBN:9781305251809Author:Jay L. DevorePublisher:Cengage Learning
 Statistics for The Behavioral Sciences (MindTap C...StatisticsISBN:9781305504912Author:Frederick J Gravetter, Larry B. WallnauPublisher:Cengage Learning
  Elementary Statistics: Picturing the World (7th E...StatisticsISBN:9780134683416Author:Ron Larson, Betsy FarberPublisher:PEARSON
 The Basic Practice of StatisticsStatisticsISBN:9781319042578Author:David S. Moore, William I. Notz, Michael A. FlignerPublisher:W. H. Freeman
 Introduction to the Practice of StatisticsStatisticsISBN:9781319013387Author:David S. Moore, George P. McCabe, Bruce A. CraigPublisher:W. H. Freeman
MATLAB: An Introduction with Applications
Statistics
ISBN:9781119256830
Author:Amos Gilat
Publisher:John Wiley & Sons Inc
Probability and Statistics for Engineering and th...
Statistics
ISBN:9781305251809
Author:Jay L. Devore
Publisher:Cengage Learning
Statistics for The Behavioral Sciences (MindTap C...
Statistics
ISBN:9781305504912
Author:Frederick J Gravetter, Larry B. Wallnau
Publisher:Cengage Learning
Elementary Statistics: Picturing the World (7th E...
Statistics
ISBN:9780134683416
Author:Ron Larson, Betsy Farber
Publisher:PEARSON
The Basic Practice of Statistics
Statistics
ISBN:9781319042578
Author:David S. Moore, William I. Notz, Michael A. Fligner
Publisher:W. H. Freeman
Introduction to the Practice of Statistics
Statistics
ISBN:9781319013387
Author:David S. Moore, George P. McCabe, Bruce A. Craig
Publisher:W. H. Freeman